Key figures
Return
Market value

The Executive Board’s assessment of the results
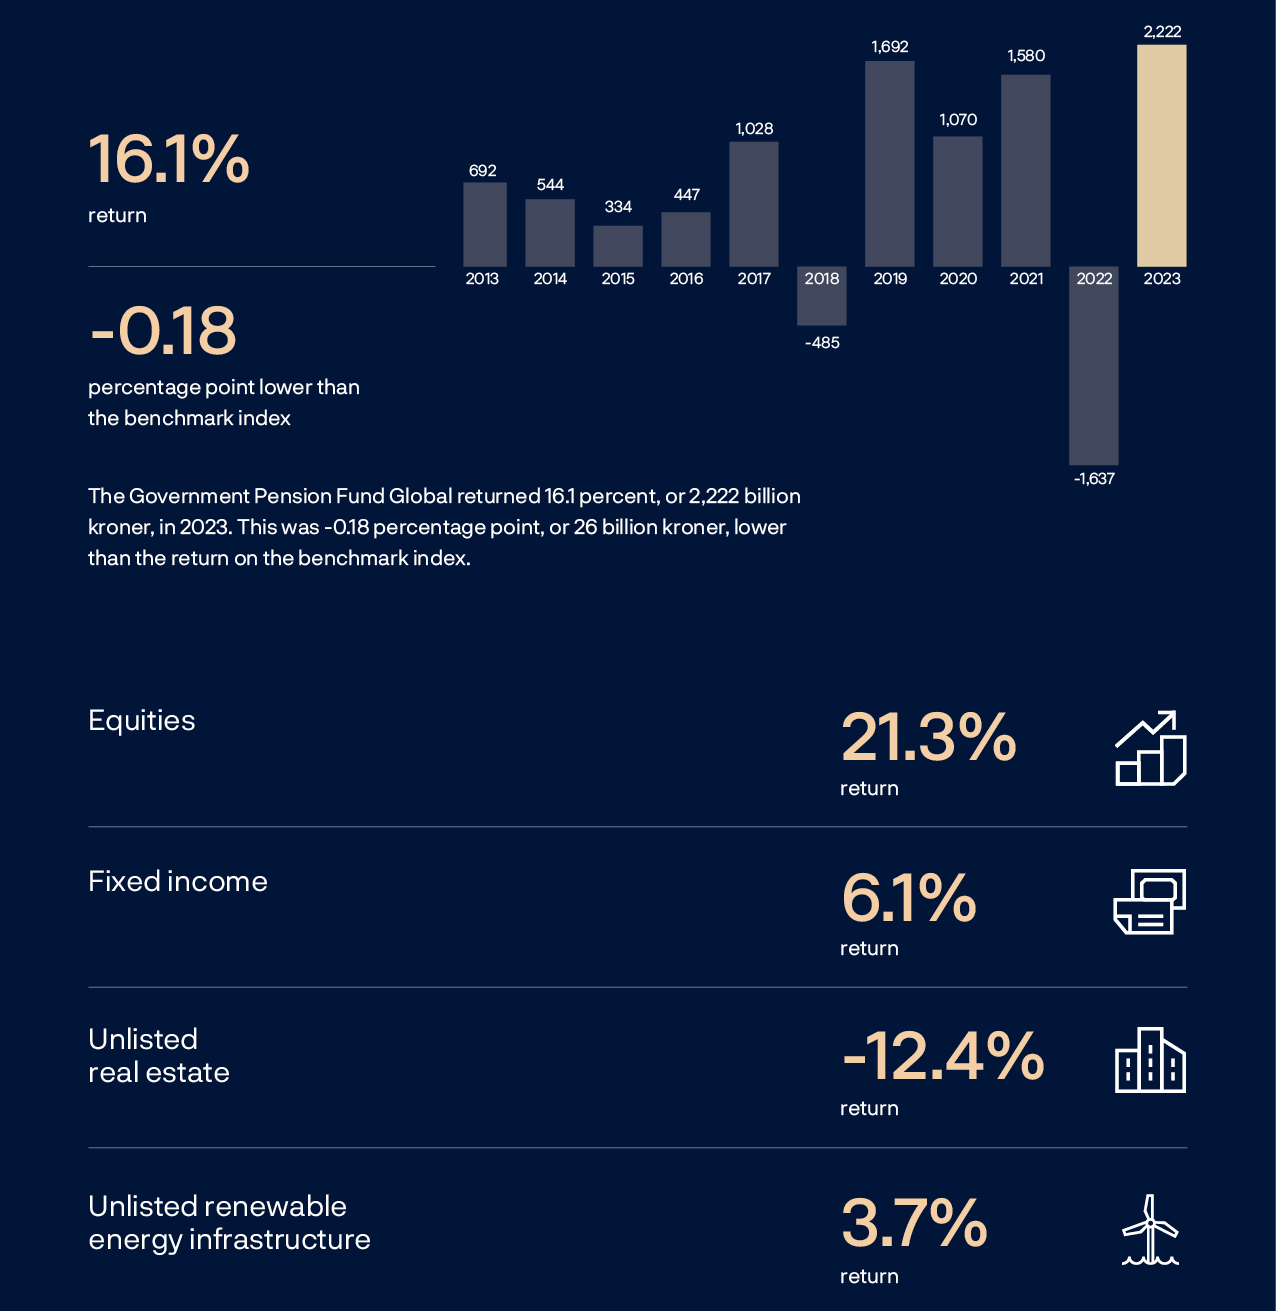
The investments in the Government Pension Fund Global returned 16.1 percent in 2023. There was considerable variation between the results for the different investment strategies. Overall, the return was 0.18 percentage point less than on the benchmark index. Over time, however, the return has been higher than the return on the benchmark index.
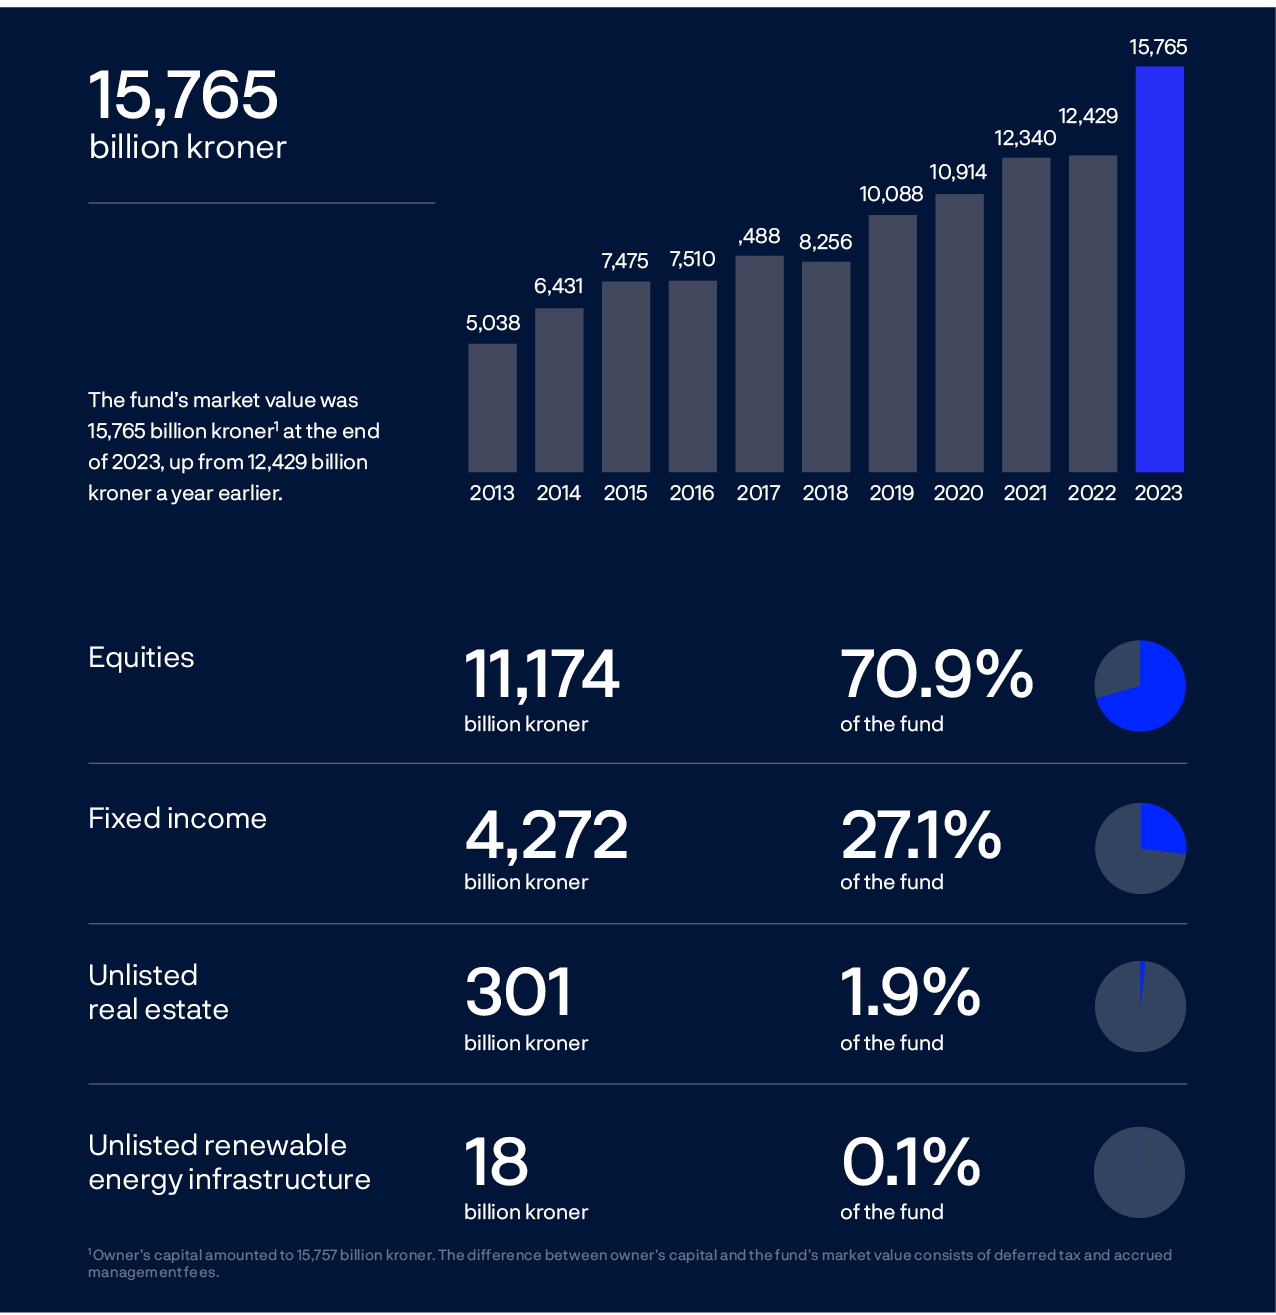
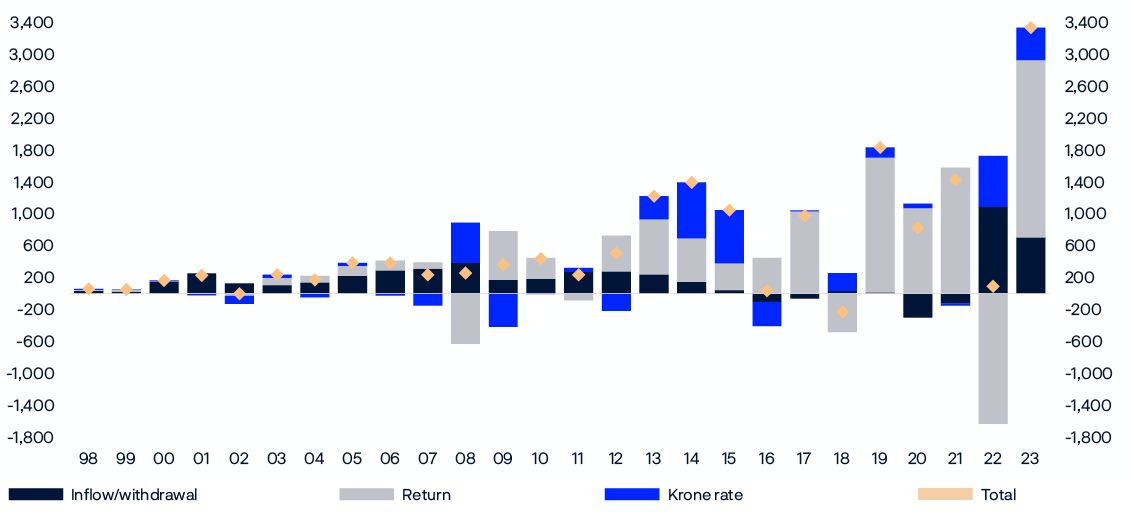
The fund’s market value increased by 3,336 billion kroner during the year to 15,765 billion kroner at the end of 2023. The increase was due mainly to strong returns on the fund’s equity and fixed-income investments. High prices for sales of oil and gas led to a net inflow of capital from the government of 704 billion kroner after the payment of management fees. A weaker krone against the currencies in which the fund is invested also increased its market value measured in kroner.
Measured in the fund’s currency basket, the return for the year was 16.1 percent, or 2,222 billion kroner, before management costs. Equities returned 21.3 percent. Stock markets were lifted by a surge in prices for technology stocks. A continued rise in central bank policy rates due to high inflation affected bond markets, but a drop in long yields towards the end of the year contributed to a return on fixed-income investment of 6.1 percent in 2023.
Investments in unlisted real estate returned -12.4 percent, and unlisted renewable energy infrastructure 3.7 percent. The return on unlisted real estate was weak both in absolute terms and relative to other asset classes. The return was pulled down by lower valuations as a result of higher real interest rates and decreased demand for office properties since the pandemic.
The fund’s investments at the end of the year broke down into 70.9 percent equities, 27.1 percent fixed income, 1.9 percent unlisted real estate and 0.1 percent unlisted renewable energy infrastructure.
With such a large fund and an equity share of around 70 percent, we have to be prepared for considerable fluctuations in the fund’s return and market value. Each year, Norges Bank publishes the results of both historical and hypothetical stress tests. The tests conducted at the end of 2023 include shocks such as an economic recession linked to high public and private debt, long-term geoeconomic conflict and repricing of the equity market. In these stress tests, the decrease in the value of the fund is estimated at around 30 percent over a period up to five years.
The Executive Board considers the return on the fund over time to have been good. In the period from 1998 to 2023, the average annual return was 6.1 percent. The annual net real return, after deductions for inflation and management costs, was 3.8 percent in the same period.
Norges Bank manages the fund with a view to achieving the highest possible long-term return within the constraints laid down in the mandate from the Ministry of Finance. The return achieved by Norges Bank is measured against the return on the fund’s benchmark index. In 2023, the fund’s return was 0.18 percentage point less than the return on the benchmark index.
Norges Bank’s investment strategies are grouped into three main categories: market exposure, security selection and fund allocation. These strategies are complementary and aim to take advantage of the fund’s size and long investment horizon. Each strategy has evolved over time.
Under the strategy for market exposure, the fund is invested broadly in the equities and bonds included in the benchmark index. The investments are made cost-effectively and with a view to contributing to the objective of the highest possible return. The strategy for security selection is based on fundamental analysis of companies, and Norges Bank uses both internal and external managers. Fund allocation consists of a number of strategies that aim to improve the fund’s long-term risk and return characteristics. Investments in real estate and unlisted renewable energy infrastructure are part of the fund allocation strategy.
The results for both market exposure and security selection were good in 2023 and contributed positively to the fund’s relative return. However, the results for fund allocation, especially investments in unlisted real estate, meant that the fund’s overall return before costs was 0.18 percentage point lower than the return on the benchmark index.
The fund’s unlisted real estate investments are almost entirely in office, logistics and retail properties. Office properties account for around half of the portfolio, and investments in office and retail premises are concentrated in a small number of major cities. Higher real interest rates since the pandemic have resulted in weak returns on real estate in general, and especially in the part of the office market where the fund is invested. The rise in working from home following the pandemic has also reduced demand for office space. The fund’s office properties returned -15.4 percent in 2023. The valuation of the office portfolio peaked in the first quarter of 2022 and has since been written down by 25.2 percent.
Unlisted real estate is not part of the benchmark index and is funded by investing less in equities and bonds. Substantial variations may occur between the return on real estate investments and their funding from year to year. The results must be assessed over time. The return on unlisted real estate investments in 2023 was considerably lower than the return on the equities and bonds sold to fund them. This meant that unlisted real estate made a contribution of -0.58 percentage point to the fund’s relative return.
Investments in listed real estate returned 16.6 percent in 2023. In isolation, this made a positive contribution to the fund’s relative return of 0.11 percentage point. The value of these investments fluctuated widely during the year but surged in the fourth quarter along with the rest of the equity market.
There was considerable variation in the results of the different investment strategies in 2023. The Executive Board considers it important for the fund’s performance to be assessed as a whole and over time, and is satisfied that the overall return over time has been higher than the return on the benchmark index, against which the return is measured.
Norges Bank has reported contributions to the relative return for the same three strategies in the period from 2013 to 2023. In this period, the average annual excess return before management costs was 0.29 percentage point. Market exposure and security selection made positive contributions to the relative return, while fund allocation made a negative contribution.
In the period from 1998 to 2023, the average annual return before management costs was 0.28 percentage point higher than the return on the benchmark index from the Ministry of Finance.
The objective of the highest possible return is to be achieved with acceptable risk. The risk in the fund is measured, analysed and followed up using a broad set of measures and different types of analysis. The management mandate requires Norges Bank to manage the fund with a view to ensuring that expected relative volatility (tracking error) does not exceed 1.25 percentage points. Expected relative volatility was 0.34 percentage point at the end of 2023, compared with 0.39 percentage point a year earlier.
Measured over the full period from 1998 to 2023, realised relative volatility has been 0.64 percentage point.
The management of the fund is to be cost-effective. Low costs are not an end in themselves, but cost-effective management supports the objective of the highest possible return after costs. In the period from 2013 to 2023, annual management costs averaged 0.05 percent of assets under management. In 2023, management costs amounted to 6.6 billion kroner, or 0.05 percent of assets under management. The Executive Board is satisfied that management costs are low compared with other managers.
The mandate from the Ministry of Finance requires responsible investment to be an integral part of the management of the fund. A good long-term return depends on sustainable economic, environmental and social development. Norges Bank published expectations of companies on consumer interests during the year, as well as views on the responsible use of artificial intelligence.
Climate risk management is a priority for responsible investment, and in 2023 Norges Bank published sharpened expectations for how companies should manage climate risk and views on the use of voluntary carbon credits. A number of companies in the portfolio committed to net zero carbon emissions during the year.
It is hard to measure the effects of work on responsible investment. Provisional results from a research project in 2023 indicate that Norges Bank’s publication of its voting decisions five days before shareholder meetings leads to increased support for the fund’s position from other shareholders.
Norges Bank’s Executive Board
A tremendous year
I began my introduction to last year’s annual report by calling 2022 “a turbulent year”. War, inflation and plummeting tech stocks had all impacted the fund negatively.

Was 2023 any less turbulent? By no means. There was even more war and conflict around the world, and inflation remained high in many countries. But equity markets – and especially US tech stocks – bounced back strongly. The big losers in 2022 were the big winners in 2023.
Some of these companies are so large and valuable that they make up more of the fund than all of our investments put together in countries such as Sweden and Australia. Microsoft, Apple and Nvidia contributed most to the fund’s return for the year.
2023 was also the year when AI was on everyone’s lips. Again, it was the tech clusters on the US West Coast that led the way. AI will undoubtedly affect the fund, both in the way we work and not least at the companies we invest in.
The fund's value increased by 90 billion kroner in 2022. In 2023 the fund’s market value jumped 3,336 billion kroner, thanks mainly to a strong return of 2,222 billion kroner and a weak krone. This took the fund past the 16 trillion kroner mark for the first time.
In 2023, we were also named the world's most open and transparent investment fund in the Global Pension Transparency Benchmark. Openness builds trust, and trust is capital which we are completely reliant on as an investment fund but can by no means take for granted. This ranking provides real motivation to continue to be as open as possible.
It is in our interest for everyone to know our views on the markets and how companies can be run as sustainably as possible. It is also in our interest for our owners – the Norwegian people – to know how we invest on their behalf.
2023 was a tremendous year for the fund. We saw the biggest increase in the value of the fund in its history, and we were crowned the world’s most transparent investment fund for the first time. Openness, as I say, is important for trust.
Eagle-eyed readers will have noticed a degree of alliteration as we moved from “a turbulent year” to“a tremendous year”. Trust also begins with a T.
Oslo, 27 February 2024

Nicolai Tangen
CEO, Norges Bank Investment Management
Strong return on the fund’s investments
The Government Pension Fund Global returned 16.1 percent, or 2,222 billion kroner, in 2023. The return in kroner was the largest in the fund’s history.

The fund’s market value grew by a record 3,336 billion kroner in 2023. A strong return on the fund’s equity investments made the greatest contribution to this growth. The krone also weakened against many of the currencies the fund is invested in, and there was an inflow of capital from the government.
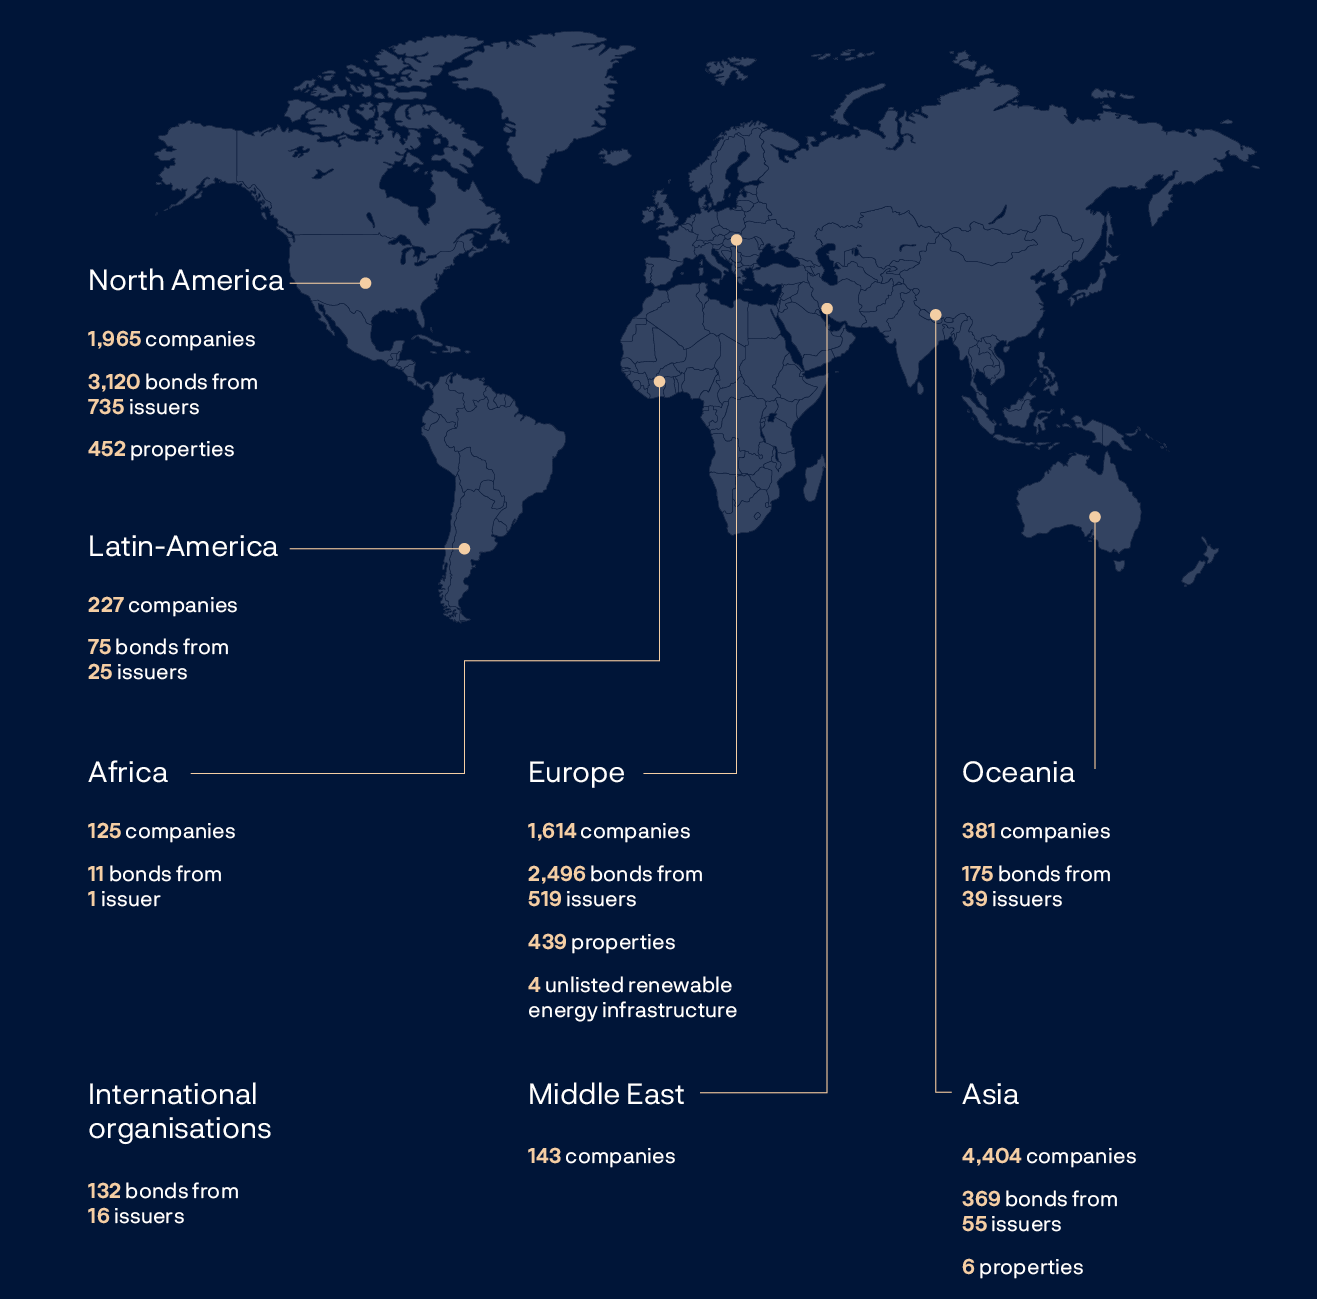
The fund’s investments spanned 72 countries and 43 currencies at the end of the year. The fund is invested in international securities and unlisted real estate and infrastructure in foreign currency. We measure returns in a basket of international currencies. This basket is defined in the management mandate as a weighted combination of the currencies in the fund’s benchmark indices for equities and bonds, and consisted of 35 currencies at the end of 2023. Unless otherwise stated, the results in this report are measured in this currency basket.
TABLE 1 The fund's ten largest holdings in percent as at 31 December 2023, by country.
|
Country |
Total |
Equity |
Fixed income |
Unlisted real estate |
Unlisted infrastruture |
|---|---|---|---|---|---|
|
US |
46.9 |
33.8 |
12.2 |
0.9 |
|
|
Japan |
7.4 |
4.9 |
2.5 |
0.0 |
|
|
UK |
6.3 |
4.3 |
1.6 |
0.4 |
|
|
Germany |
4.8 |
2.5 |
2.2 |
0.1 |
0.0 |
|
France |
4.4 |
3.0 |
1.1 |
0.3 |
|
|
Switzerland |
3.4 |
2.8 |
0.5 |
0.1 |
|
|
Canada |
3.0 |
1.4 |
1.6 |
||
|
Netherlands |
2.3 |
1.6 |
0.6 |
0.0 |
0.1 |
|
China |
2.1 |
2.1 |
0.0 |
||
|
Australia |
2.0 |
1.4 |
0.6 |
CHART 1 The fund’s investments as at 31 December 2023. Equities, unlisted real estate and infrastructure distributed by country and bonds by currency. In percent.
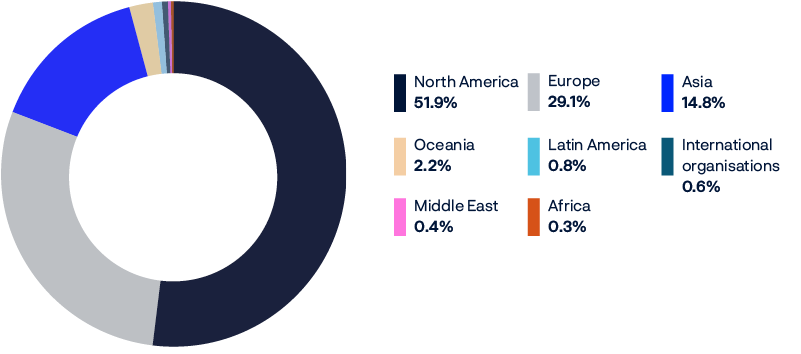
TABLE 2 Return figures in percent.
|
2023 |
2022 |
20211 |
2020 |
2019 |
|
|---|---|---|---|---|---|
|
Returns measured in the fund's currency basket |
|||||
|
Equity investments |
21.25 |
-15.36 |
20.76 |
12.14 |
26.02 |
|
Fixed-income investments |
6.13 |
-12.11 |
-1.93 |
7.46 |
7.56 |
|
Unlisted real estate investments |
-12.37 |
0.07 |
13.64 |
-0.08 |
6.84 |
|
Unlisted infrastructure investments |
3.68 |
5.12 |
4.15 |
||
|
Return on fund |
16.14 |
-14.11 |
14.51 |
10.86 |
19.95 |
|
Relative return on fund (percentage points) |
-0.18 |
0.87 |
0.75 |
0.27 |
0.23 |
|
Management costs |
0.05 |
0.04 |
0.04 |
0.05 |
0.05 |
|
Return on fund after management costs |
16.09 |
-14.15 |
14.47 |
10.81 |
19.90 |
|
Returns in kroner |
|||||
|
Equity investments |
26.26 |
-9.27 |
20.67 |
12.70 |
28.20 |
|
Fixed-income investments |
10.51 |
-5.78 |
-2.01 |
8.00 |
9.41 |
|
Unlisted real estate investments |
-8.75 |
7.27 |
13.55 |
0.42 |
8.68 |
|
Unlisted infrastructure investments |
7.96 |
12.69 |
7.24 |
||
|
Return on fund |
20.93 |
-7.93 |
14.42 |
11.41 |
22.01 |
1 First unlisted infrastructure investment was made in second quarter of 2021.
TABLE 3 Historical key figures as at 31 December 2023. Annualised data, measured in the fund's currency basket.
|
Since 01.01.1998 |
Last 15 years |
Last 10 years |
Last 5 years |
Last 12 months |
|
|---|---|---|---|---|---|
|
Fund return (percent) |
6.09 |
8.46 |
6.71 |
8.72 |
16.14 |
|
Annual price inflation (percent) |
2.10 |
2.29 |
2.43 |
3.52 |
3.20 |
|
Annual management costs (percent) |
0.08 |
0.06 |
0.05 |
0.05 |
0.05 |
|
Net real return on fund (percent) |
3.83 |
5.96 |
4.13 |
4.97 |
12.49 |
|
The fund's actual standard deviation (percent) |
8.46 |
9.42 |
9.62 |
12.05 |
10.68 |
|
Relative return on fund (percentage points)1 |
0.28 |
0.53 |
0.22 |
0.42 |
-0.18 |
|
The fund's tracking error (percentage points)1 |
0.64 |
0.53 |
0.41 |
0.46 |
0.44 |
|
The fund's information ratio (IR)1,2 |
0.44 |
0.95 |
0.51 |
0.83 |
-0.42 |
1Based on aggregated equity and fixed-income investments until end of 2016.
2The fund's information ratio (IR) is the ratio of the fund's average monthly relative return to the fund's tracking error. The IR indicates how much relative return has been achieved per unit of relative risk.
CHART 2 The fund’s annual return and accumulated annualised return in percent.
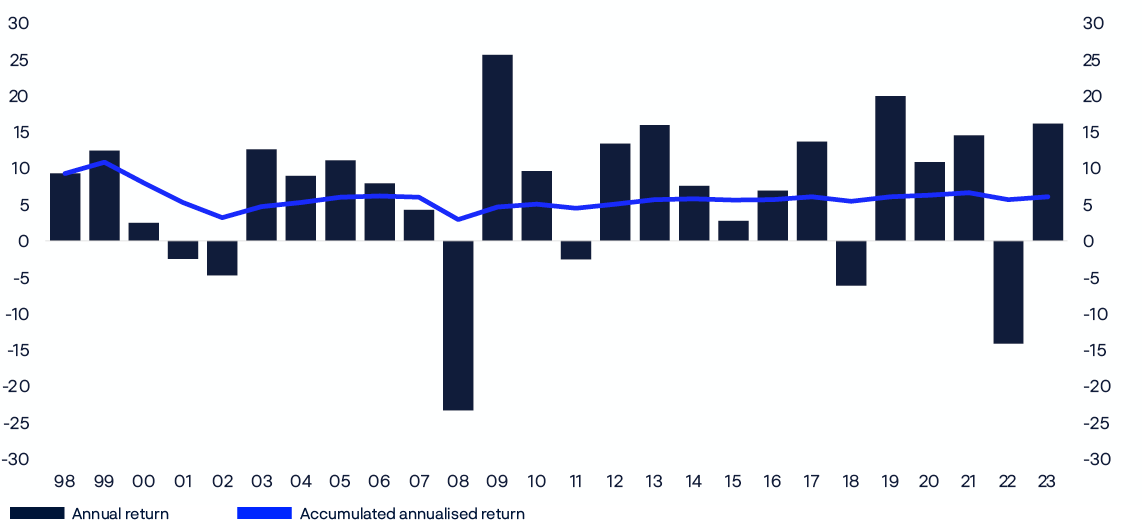
TABLE 4 Return on the fund in percent as at 31 December 2023, measured in various currencies.
|
Since 01.01.1998 Annualised figures |
2023 |
2022 |
2021 |
2020 |
2019 |
|
|---|---|---|---|---|---|---|
|
US dollar |
6.15 |
17.30 |
-17.58 |
11.09 |
14.35 |
20.24 |
|
Euro1 |
6.13 |
13.33 |
-12.18 |
19.53 |
4.90 |
22.45 |
|
British pound |
7.23 |
10.68 |
-7.19 |
12.12 |
10.82 |
15.59 |
|
Norwegian krone |
7.50 |
20.93 |
-7.93 |
14.42 |
11.41 |
22.01 |
|
Currency basket |
6.09 |
16.14 |
-14.11 |
14.51 |
10.86 |
19.95 |
1Euro was introduced as currency on 01.01.1999. WM/Reuters' euro rate is used as estimate for 31.12.1997.
TABLE 5Key figures in billions of kroner.
|
2023 |
2022 |
2021 |
2020 |
2019 |
|
|---|---|---|---|---|---|
|
Market value |
|||||
|
Equity investments |
11,174 |
8,672 |
8,878 |
7,945 |
7,145 |
|
Fixed-income investments |
4,272 |
3,412 |
3,135 |
2,695 |
2,670 |
|
Unlisted real estate investments |
301 |
330 |
312 |
273 |
273 |
|
Unlisted infrastructure investments1 |
18 |
15 |
14 |
||
|
Market value of fund2 |
15,765 |
12,429 |
12,340 |
10,914 |
10,088 |
|
Deferred tax |
-8 |
||||
|
Accrued, not paid, management fees3 |
0 |
0 |
1 |
-5 |
-4 |
|
Owner's capital2 |
15,757 |
12,429 |
12,340 |
10,908 |
10,084 |
|
Inflow of capital |
711 |
1,090 |
80 |
4 |
32 |
|
Withdrawal of capital |
0 |
0 |
-199 |
-302 |
-14 |
|
Paid management fees4 |
-7 |
-5 |
-10 |
-4 |
-5 |
|
Return on fund5 |
2,222 |
-1,637 |
1,580 |
1,070 |
1,692 |
|
Changes due to fluctuations in krone |
409 |
642 |
-25 |
58 |
127 |
|
Total change in market value |
3,336 |
90 |
1,426 |
826 |
1,832 |
|
Changes in value since first capital inflow in 1996 |
|||||
|
Total inflow of capital |
5,455 |
4,744 |
3,654 |
3,574 |
3,570 |
|
Total withdrawal of capital3 |
-687 |
-687 |
-687 |
-482 |
-182 |
|
Return on equity investments |
7,326 |
5,280 |
6,485 |
4,897 |
4,023 |
|
Return on fixed-income investments |
1,192 |
970 |
1,401 |
1,446 |
1,249 |
|
Return on unlisted real estate investments |
71 |
119 |
120 |
84 |
85 |
|
Return on unlisted infrastructure investments1 |
2 |
2 |
1 |
||
|
Management fees4 |
-70 |
-63 |
-58 |
-53 |
-48 |
|
Changes due to fluctuations in krone |
2,474 |
2,065 |
1,423 |
1,448 |
1,390 |
|
Market value of fund |
15,765 |
12,429 |
12,340 |
10,914 |
10,088 |
|
Return on fund |
8,592 |
6,370 |
8,007 |
6,427 |
5,358 |
|
Return after management costs |
8,522 |
6,307 |
7,949 |
6,374 |
5,309 |
1First unlisted infrastructure investment was made in the second quarter of 2021.
2From 2023, market value is presented before management fee receivable and deferred tax. Up to and including 2022, market value was presented before management fee receivable.
3Total inflow and withdrawal of capital shown in this table is adjusted for accrued, not paid, management fees.
4Management fees are describe in note 12 in the financial statements.
5Fund return reflects the return on the market value of the investment portfolio, that does not include deferred tax. The portfolio result of 2,214 million kroner in the financial statements includes the impact of changes in deferred tax.
CHART 3 Historical returns on the fund’s investments in percent, by asset class.
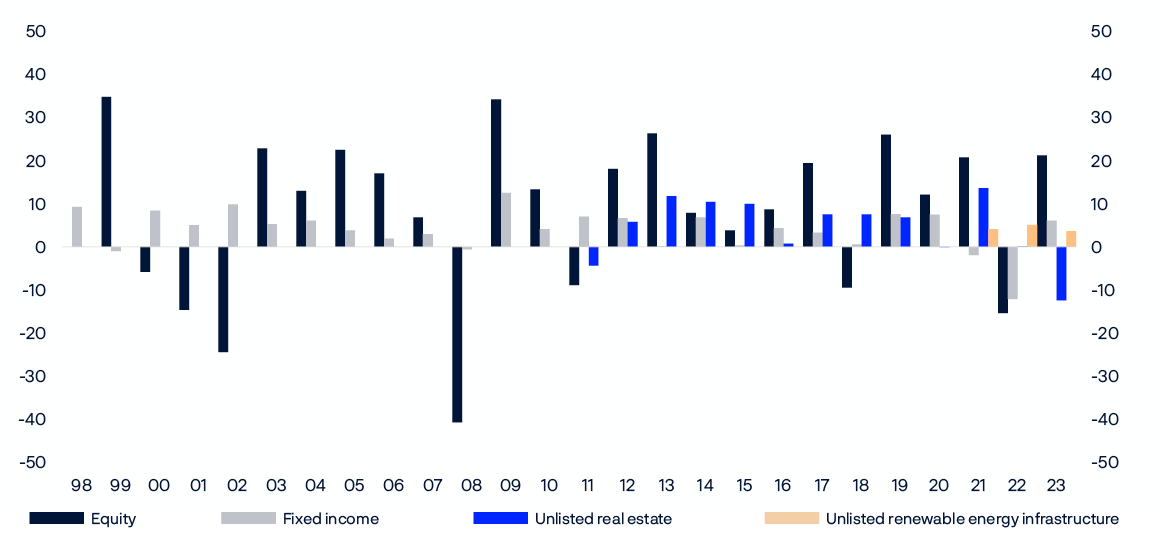
CHART 4 The fund’s market value in billions of kroner, by asset class.
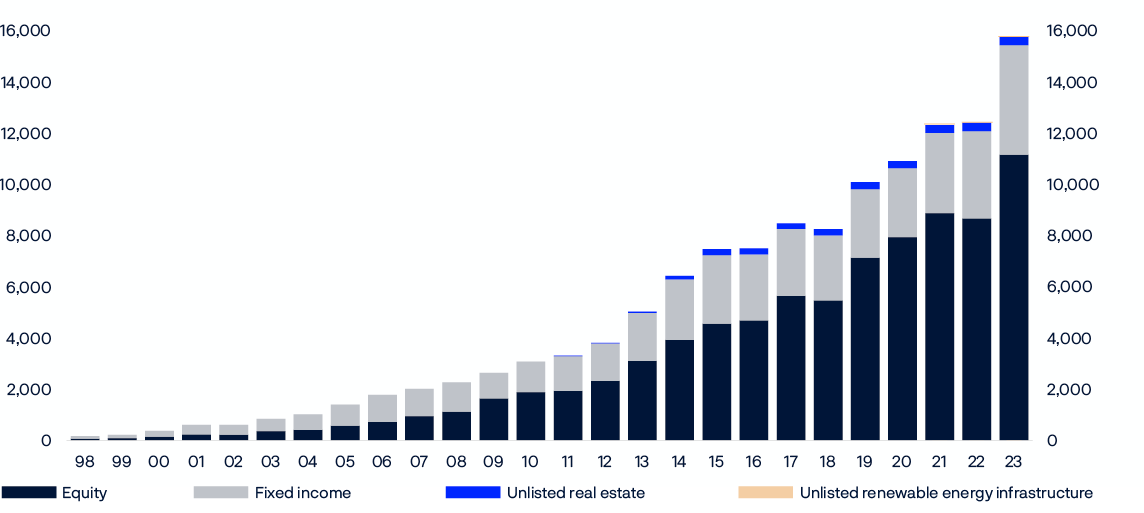
CHART 5 The fund’s market value in billions of kroner.
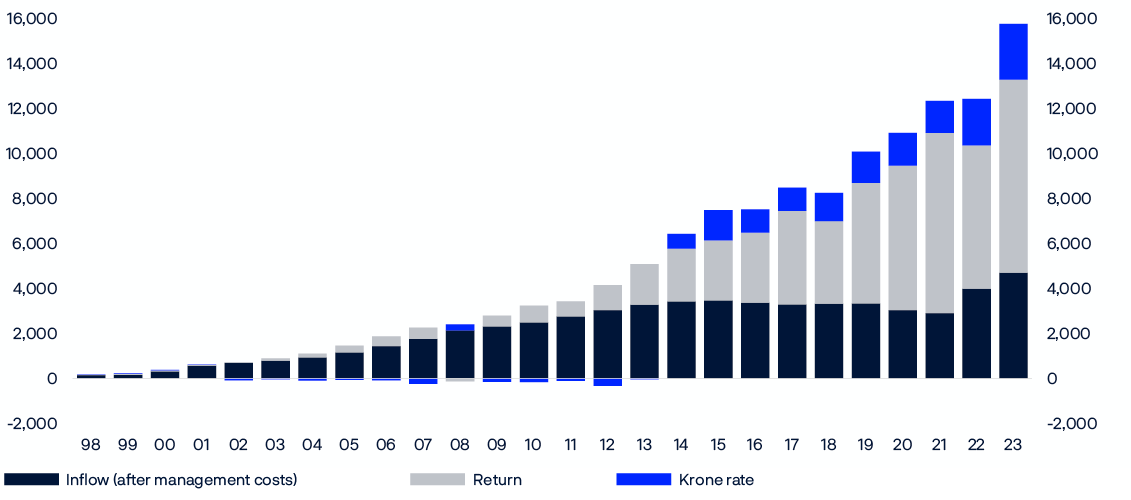
CHART 6 Changes in the fund’s market value in billions of kroner.

Strong year for equity investments
The fund’s equity investments returned 21.3 percent in 2023. Despite strong inflation, rising policy rates and geopolitical turmoil, the stock market rallied after a weak 2022. Higher interest rates reined in inflation during the year without sparking a sharp economic downturn.

US technology stocks in particular contributed to the positive return, driven mainly by the largest technology companies.
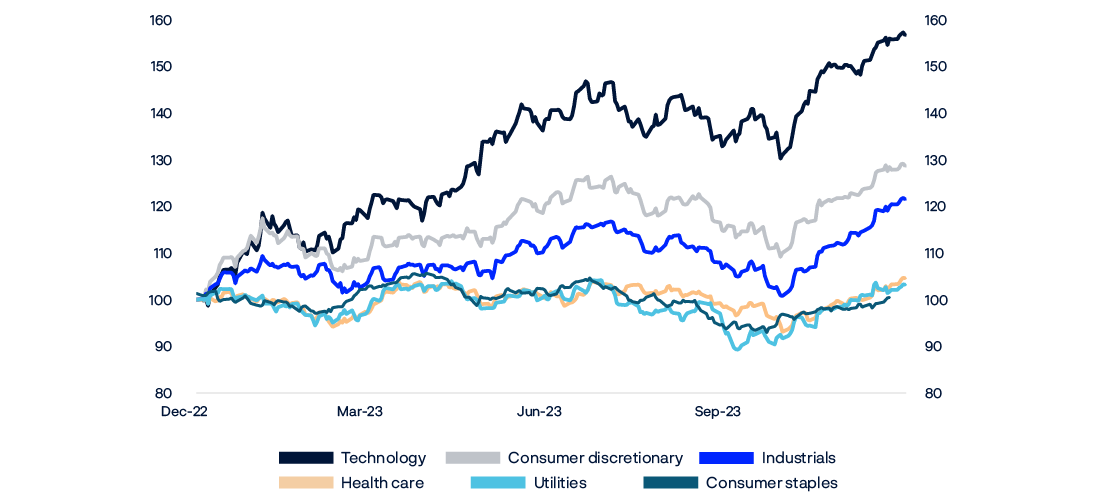
Tech stocks perform best
Technology stocks were the best performers in 2023 with a return of 51.9 percent. The sector benefited from efficiencies and increased demand for new AI solutions from the biggest internet and software companies and their semiconductor suppliers.
Consumer discretionary was the next-strongest sector, returning 26.0 percent. Consumption and economic activity generally held up over the year despite higher prices and rising interest rates, but there were signs of weaker demand in the second half, especially among producers of luxury goods and drinks.
Industrials were the third-strongest sector with a return of 22.1 percent. Despite fears of recession, demand remained strong. Prices for products held up despite the strong inflation of 2022. Raw materials costs fell, and in many cases this led to higher margins than expected.
Consumer staples produced the weakest return of 1.0 percent. Sales of household goods such as food and drink fell. Consumers adjusted to higher prices and shifted their spending towards activities such as travel and dining out.
Individual investments
The fund was invested in 8,859 companies at the end of 2023, down from 9,228 a year earlier. The decrease was mainly due to ongoing portfolio adjustments made by our internal and external managers.
The investments in technology companies Microsoft, Apple and Nvidia made the biggest contributions to the return for the year. The worst-performing investments were in health care company Pfizer, technology company Meituan and energy company NextEra Energy.
We participated in 45 initial public offerings during the year. The largest of these were at Adnoc Gas PLC, Kenvue Inc and in Societatea De Producere A Energiei Electrice. The offerings in which the fund invested the most were at Birkenstock Holding PLC and Maplebear Inc.
At the end of the year, the fund had holdings of more than 2 percent in 1,186 companies, and more than 5 percent in 65 companies. Its average holding in the world’s listed companies was 1.5 percent.
Excluding listed real estate companies, the largest percentage holding in any one company was in industrial company Nikola. The fund’s 9.2 percent stake was worth 950.9 million kroner. With the exception of listed real estate companies, the fund may hold no more than 10 percent of the voting shares in a company.
TABLE 6 Return on the fund's largest equity investments in 2023 by country. In percent.
|
Country |
Return in international currency |
Return in local currency |
Share of equity investments1 |
|---|---|---|---|
|
US |
27.0 |
28.3 |
48.6 |
|
Japan |
18.2 |
27.5 |
7.1 |
|
UK |
16.1 |
10.7 |
6.3 |
|
France |
19.7 |
16.8 |
4.3 |
|
Switzerland |
16.9 |
7.4 |
4.1 |
|
Germany |
23.7 |
20.7 |
3.6 |
|
China |
-14.4 |
-11.8 |
3.0 |
|
Australia |
23.6 |
20.6 |
2.2 |
|
Netherlands |
26.3 |
28.3 |
2.2 |
|
Canada |
34.4 |
35.6 |
2.1 |
1 Does not sum up to 100 percent because cash and derivatives are not included.
TABLE 7 Return on the fund's equity investments in 2023. Measured in international currency and sorted by sector. In percent.
|
Sector |
Return |
Share of equity investments1 |
|---|---|---|
|
Technology |
51.9 |
22.3 |
|
Financials |
18.3 |
15.0 |
|
Consumer discretionary |
26.0 |
14.1 |
|
Industrials |
22.1 |
13.1 |
|
Health care |
5.0 |
11.1 |
|
Consumer staples |
1.0 |
5.6 |
|
Real estate |
12.8 |
5.5 |
|
Basic materials |
10.8 |
4.0 |
|
Energy |
6.0 |
3.7 |
|
Telecommunications |
11.9 |
3.3 |
|
Utilities |
5.5 |
2.4 |
1 Does not sum up to 100 percent because cash and derivatives are not included.
CHART 7 The fund’s holdings in equity markets. Percentage of market value of equities in the benchmark index.
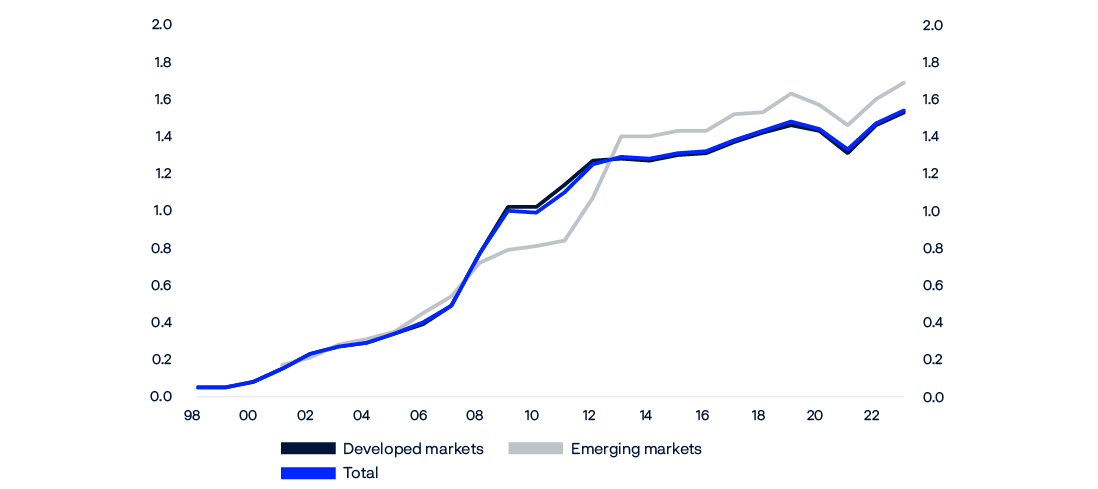
Source: FTSE Russell, Norges Bank Investment Management
CHART 8 The fund’s holdings in equity markets. Percentage of market value of equities in the benchmark index.
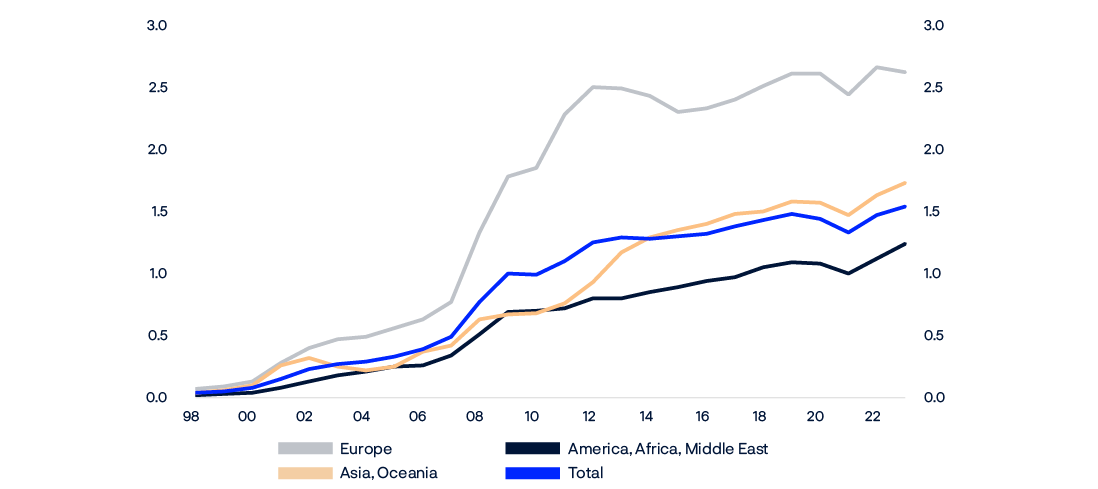
Source: TSE Russell, Norges Bank Investment Management
CHART 9 Price developments in regional equity markets. Measured in dollars. Indexed total return 31.12.2022 = 100.
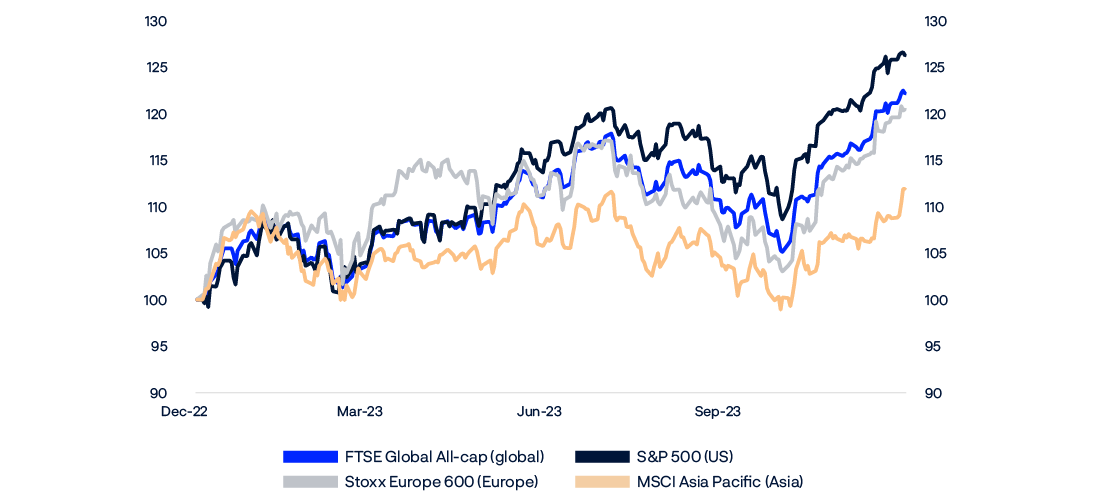
Source: Bloomberg
CHART 10 Price developments of the three sectors with the highest and weakest return in the FTSE Global All Cap index. Measured in dollars. Indexed total return 31.12.2022 = 100.
Source: FTSE Russell
Positive return on fixed-income investments
The fund’s fixed-income investments returned 6.1 percent in 2023. Yields rose for much of the year before dropping back in the last two months.

The drop in yields at the end of the year was a result of inflation falling faster than expected. The world’s central banks, led by the Federal Reserve, therefore signalled rate cuts in the coming year.
Strongest return on corporate bonds
Government bonds returned 3.9 percent in 2023 and made up 60.7 percent of the fund’s fixed-income investments at the end of the year.
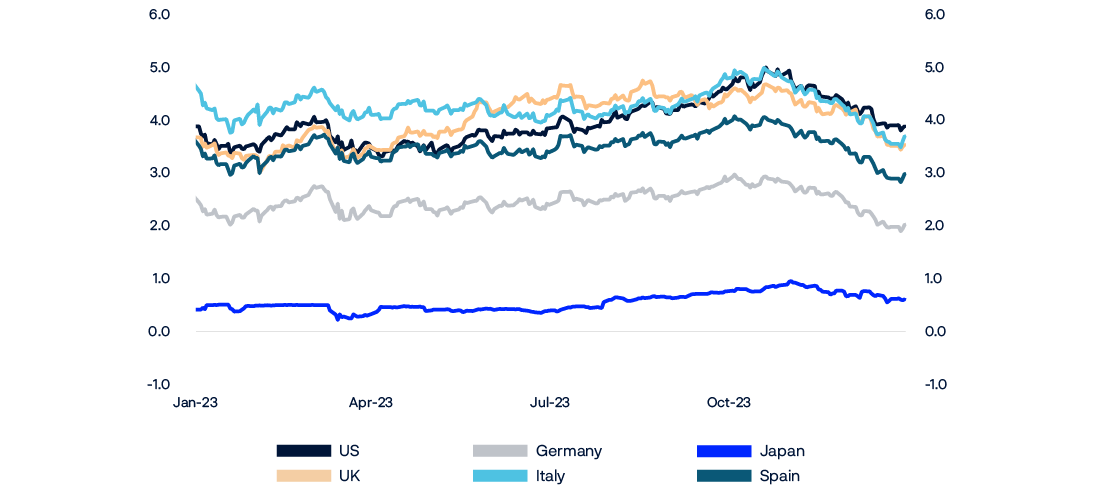
US Treasuries returned 3.1 percent and accounted for 28.3 percent of fixed-income investments. The Federal Reserve raised its policy rate by a total of 1 percentage point during the year in response to a tight labour market and high inflation. Ten-year Treasury yields hit 5 percent in October, their highest since 2007, before dropping back below 4 percent at the end of the year.
Euro-denominated government bonds returned 10.3 percent and amounted to 11.1 percent of fixed-income investments. The European Central Bank tightened its monetary policy considerably during the year, raising its policy rate by a total of 2 percentage points. This had little impact on market pricing of bonds with long maturities. Together with a strong euro, this resulted in good returns.
Japanese government bonds made up 8.0 percent of fixed-income holdings and returned -7.0 percent. The Bank of Japan made only minor adjustments to its monetary policy during the year. The weak return was mainly a result of a sharp fall in the yen during the year.
Corporate bonds returned 8.9 percent and made up 23.5 percent of the fund’s fixed-income investments at the end of the year. The return was boosted by a reduction in the credit premium, which is the compensation that investors demand for holding bonds of this type rather than less risky government bonds.
TABLE 8 Return on the fund's largest bond holdings by currency in 2023. In percent.
|
Currency |
Return in international currency |
Return in local currency |
Share of fixed-income investments |
|---|---|---|---|
|
US dollar |
4.8 |
5.8 |
49.3 |
|
Euro |
10.1 |
7.5 |
26.8 |
|
Japanese yen |
-6.9 |
0.4 |
8.6 |
|
Singapore dollar |
6.7 |
6.0 |
5.3 |
|
Canadian dollar |
7.6 |
5.7 |
5.1 |
|
British pounds |
10.3 |
5.1 |
4.9 |
|
Australian dollar |
6.1 |
6.5 |
2.3 |
|
Swiss franc |
17.1 |
7.6 |
0.8 |
|
Swedish krona |
7.7 |
5.2 |
0.7 |
|
New Zealand dollar |
5.4 |
6.4 |
0.6 |
TABLE 9 Return on the fund's fixed-income investments in 2023. Measured in international currency and sorted by sector. In percent.
|
Sector |
Return |
Share of fixed-income investments1 |
|---|---|---|
|
Government bonds2 |
3.9 |
60.7 |
|
Government-related bonds2 |
8.5 |
9.5 |
|
Inflation-linked bonds2 |
4.5 |
6.6 |
|
Corporate bonds |
8.9 |
23.5 |
|
Securitised bonds |
8.1 |
6.6 |
1Does not sum up to 100 percent because cash and derivatives are not included.
2Governments may issue different types of bonds, and the fund’s investments in these bonds are grouped accordingly. Bonds issued by a country’s government in the country’s own currency are categorised as government bonds. Bonds issued by a country’s government in another country’s currency are government-related bonds. Inflation-linked bonds issued by governments are grouped with inflation-linked bonds.

CHART 11 The fund’s holdings in fixed-income markets. Percentage of market value of bonds in the benchmark index.
SOURCE: Bloomberg Barclays Indices, Norges Bank Investment Management
CHART 12 Price developments for bonds issued in various currencies. Measured in local currencies. Indexed total return 31.12.2022 = 100.
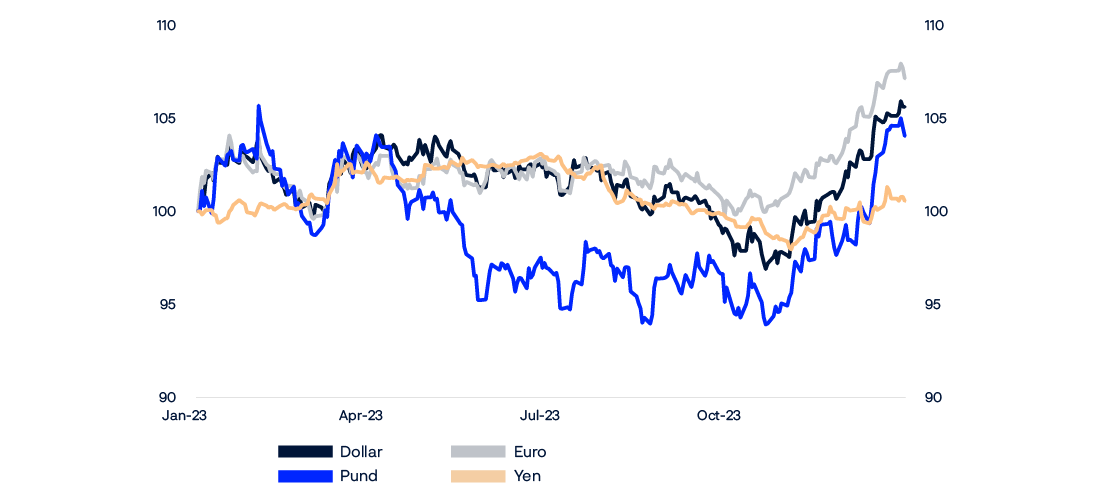
SOURCE: Bloomberg Barclays Indices
CHART 13 Price developments in fixed-income sectors. Measured in dollars. Indexed total return 31.12.2022 = 100.
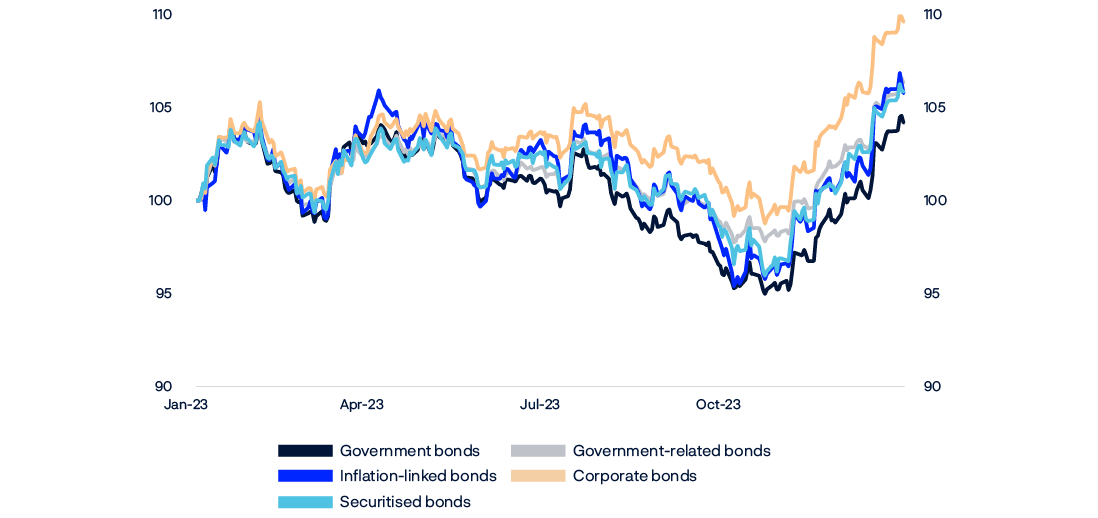
SOURCE: Bloomberg Barclays Indices
CHART 14 10-year government bond yields in percent.
SOURCE: Bloomberg
Weak year for real estate
The fund’s investments in real estate returned -0.2 percent in 2023 and made up 3.9 percent of the fund at the end of the year. Unlisted real estate investments returned -12.4 percent, and listed real estate investments 16.6 percent.

The fund’s real estate strategy covers both unlisted and listed real estate investments. Altogether, these investments amounted to 611 billion kroner at the end of the year.
TABLE 10 Value of real estate investments in millions of kroner as at 31 December 2023.
|
Value1 |
|
|---|---|
|
Unlisted real estate investments |
301,128 |
|
Listed real estate investments |
309,443 |
|
Aggregated real estate investments |
610,572 |
1Including bank deposits and other receivables.
Unlisted real estate
The fund’s investments in unlisted real estate had a market value of 301 billion kroner at the end of the year, equivalent to 1.9 percent of the fund and 49.3 percent of our total real estate investments.
The fund’s unlisted real estate investments are almost entirely in office, retail and logistics properties. Office properties account for around half of the portfolio, and investments in office and retail premises are concentrated in a small number of major cities.
2023 was a year of uncertainty in the real estate market. The return on investments in unlisted real estate were affected by lower valuations in the wake of higher real interest rates and reduced demand for office space since the pandemic. The portfolio’s cumulative return peaked in mid-2022 and has since fallen by 22.4 percent.
The fund’s office properties returned -15.4 percent in 2023. The valuation of the office portfolio peaked in the first quarter of 2022 and has since been written down by 25.2 percent. Despite weaker valuations, rental income was stable from 2022 to 2023 and contributed 3.4 percentage points to the return for the year.

The management mandate from the Ministry of Finance sets an upper limit for unlisted real estate investments of 7 percent of the fund’s value. The fund has a long-term investment strategy and limited borrowing needs, which means that we can invest selectively when market corrections create attractive opportunities.
TABLE 11 Return on the fund's unlisted real estate investments in percentage points.
|
Since 01.04.2011 |
2023 |
2022 |
2021 |
2020 |
2019 |
|
|---|---|---|---|---|---|---|
|
Rental income |
3.7 |
3.4 |
3.1 |
3.4 |
3.4 |
3.6 |
|
Change in value |
1.2 |
-16.2 |
-3.0 |
9.8 |
-3.5 |
3.1 |
|
Transaction costs |
-0.7 |
-0.1 |
-0.1 |
-0.1 |
-0.2 |
-0.1 |
|
Currency effect |
0.2 |
1.1 |
0.1 |
0.2 |
0.3 |
0.1 |
|
Total (percent) |
4.3 |
-12.4 |
0.1 |
13.6 |
-0.1 |
6.8 |
TABLE 12 The fund's largest unlisted real estate investments as at 31 December 2023.
|
Retail, office and other by city1 |
Percent |
|---|---|
|
Paris |
21.8 |
|
London |
20.5 |
|
New York |
15.2 |
|
Boston |
13.9 |
|
Berlin |
7.0 |
|
Zurich |
5.7 |
|
Washington, D.C. |
5.4 |
|
San Francisco |
4.4 |
|
Tokyo |
4.1 |
|
Sheffield |
1.2 |
|
Cambridge |
0.5 |
1Excluding investments in logistics.
|
Logistics by country |
Percent |
|---|---|
|
US |
65.6 |
|
UK |
12.5 |
|
France |
4.5 |
|
Netherlands |
3.3 |
|
Spain |
3.0 |
|
Italy |
2.6 |
|
Germany |
2.4 |
|
Czech Republic |
2.3 |
|
Other countries |
3.8 |
TABLE 13 Return on the fund's unlisted real estate investment by market as at 31 December 2023. In percent.
|
Market |
Return |
Share of portfolio |
|---|---|---|
|
Europe |
-10.4 |
48.7 |
|
US |
-16.8 |
48.6 |
|
Japan |
5.1 |
2.7 |
CHART 15 The fund’s unlisted real estate investments by sector as at 31 December 2023.
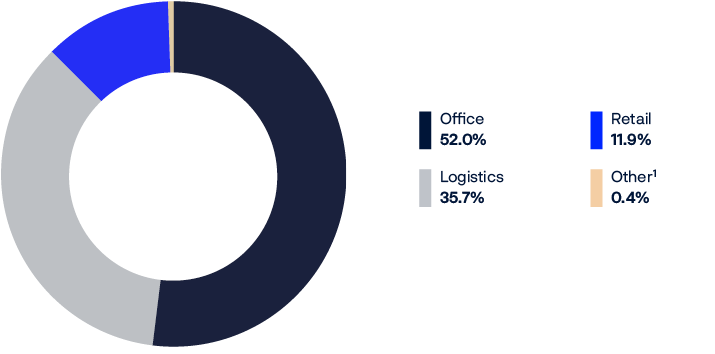
1Other sectors, bank deposits and other claims.
CHART 16 The fund’s unlisted real estate investments by country as at 31 December 2023.
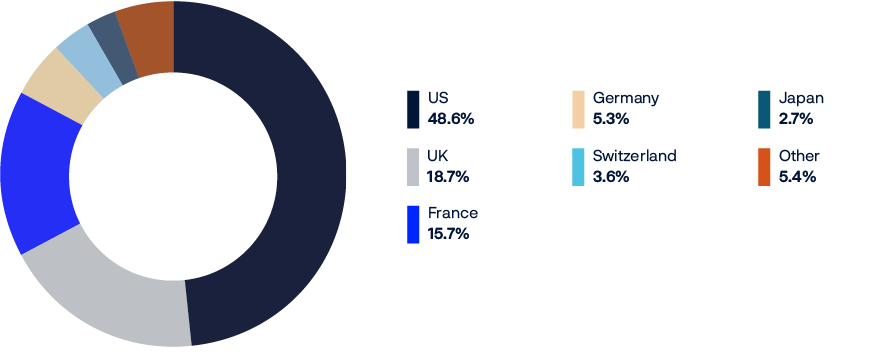
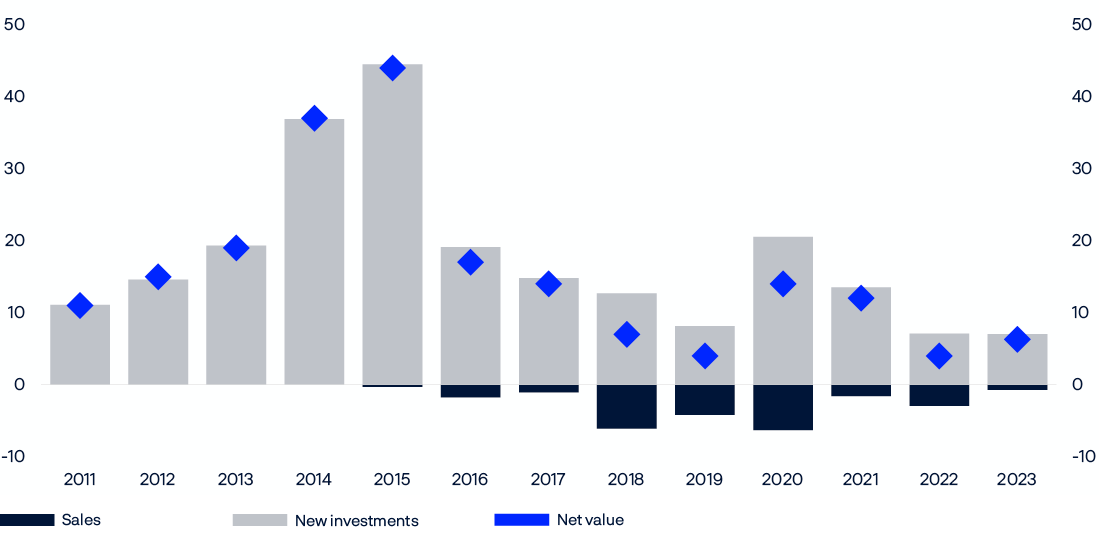
CHART 17 Annual investments in unlisted real estate. Completed transactions in billions of kroner.
Listed real estate
Investments in listed real estate made up 2.0 percent of the fund and 50.7 percent of our total real estate investments at the end of the year.
These investments were spread across 49 listed companies. The largest percentage stake was 25.2 percent of Shaftesbury Capital. The fund also had holdings above 10 percent in Vonovia and Great Portland Estates. The single largest investment was in Vonovia at 38,759 million kroner.
TABLE 14 Ownership shares in percent for the ten largest listed real estate investments as at 31 December 2023.
|
Company |
Country |
Ownership share1 |
|---|---|---|
|
Shaftesbury Capital PLC |
UK |
25.2 |
|
Vonovia SE |
Germany |
14.9 |
|
Great Portland Estates PLC |
UK |
12.0 |
|
Alexandria Real Estate Equities Inc |
US |
9.4 |
|
Gecina SA |
France |
9.3 |
|
Equity Residential |
US |
9.2 |
|
Grainger PLC |
UK |
9.1 |
|
Vornado Realty Trust |
US |
9.1 |
|
Segro PLC |
UK |
9.1 |
|
Regency Centers Corp |
US |
8.9 |
1Including holdings held as part of equity management.
TABLE 15 The fund's ten largest listed real estate investments. In millions of kroner as at 31 December 2023.
|
Company |
Country |
Holding1 |
|---|---|---|
|
Vonovia SE |
Germany |
38,759 |
|
Simon Property Group Inc |
US |
25,895 |
|
Welltower Inc |
US |
24,793 |
|
Equity Residential |
US |
21,711 |
|
Digital Realty Trust Inc |
US |
21,650 |
|
Alexandria Real Estate Equities Inc |
US |
21,132 |
|
Equinix Inc |
US |
15,798 |
|
Invitation Homes Inc |
US |
13,627 |
|
AvalonBay Communities Inc |
US |
12,850 |
|
Segro PLC |
UK |
12,765 |
1Including holdings held as part of equity management.
Unlisted renewable energy infrastructure
Investments in unlisted renewable energy infrastructure returned 3.7 percent and made up 0.1 percent of the fund at the end of the year.

The return on investments in renewable energy infrastructure comprises the net income from these assets and the change in their value during the period. Expected future power prices, expected future production volumes and the estimated cost of capital impact valuations. The value of the assets decreases over time due to the shorter expected remaining life of the investment.
The positive return in 2023 was due primarily to net income from sales of power. Valuations fell during the year, mainly as a result of a decrease in expected future power prices.
The fund made two new investments in unlisted renewable energy infrastructure during the year. In January, we signed an agreement to acquire a 49 percent interest in a portfolio of solar and onshore wind assets in Spain for 600 million euros, or around 6.4 billion kroner. In March, we signed an agreement to purchase a 16.6 percent stake in He Dreiht, a 960 MW offshore wind project under construction in Germany, for 430 million euros, or around 4.9 billion kroner. This investment was made as part of a consortium that acquired a total of 49.9 percent of the project. The management mandate from the Ministry of Finance sets an upper limit for investments in unlisted renewable energy infrastructure of 2 percent of the fund’s value.
TABLE 16Value of unlisted infrastructure investments in millions of kroner as at 31 December 2023.
|
Value1 |
|
|---|---|
|
Unlisted infrastructure investments |
17,660 |
1Including bank deposits and other receivables.
TABLE 17 Return of unlisted infrastructure investments in percent as at 31 December 2023.
|
Return |
|
|---|---|
|
Unlisted infrastructure investments |
3.68 |
Investment risk
With a large, global fund and a 70 percent allocation to equities, we have to be prepared for considerable fluctuations in the fund’s return and market value.
Risk management and volatility
The risk in the fund is driven largely by the share invested in equities and how much equity prices fluctuate. Movements in interest rates, credit risk premiums and exchange rates will also affect risk, as will changes in the value of investments in unlisted real estate and renewable energy infrastructure. As an investor, we need to have good systems for analysing and managing the risk in the fund.
Measuring the risk to which the fund is exposed is a challenge. To obtain the broadest possible picture, we use a variety of analyses and calculations. We monitor the fund’s concentration risk, expected fluctuations in markets and fund value, factor exposures and liquidity risk. We also perform stress tests and hypothetical scenario analyses on the portfolio. Some investment strategies expose the fund to an increased risk of rare but large and to some extent unpredictable losses. We closely monitor exposure to strategies of this type.
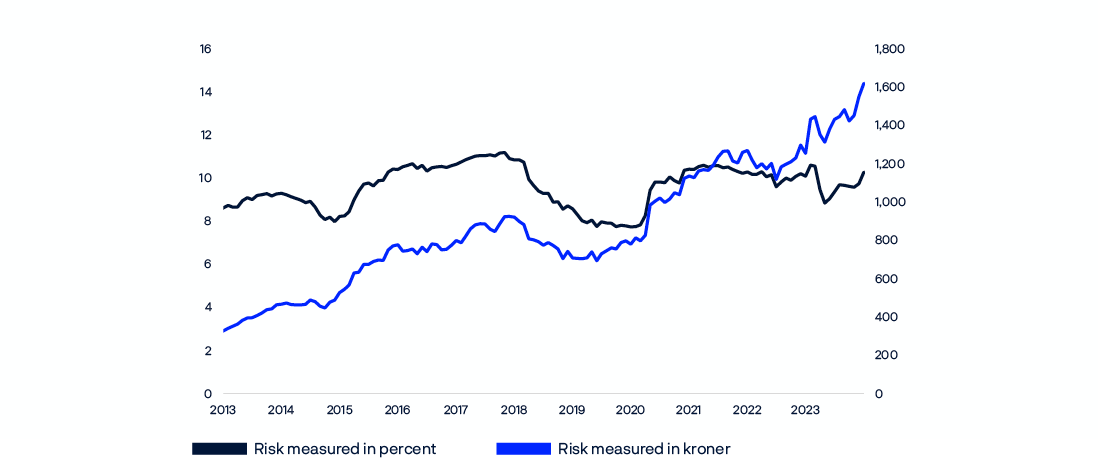
Expected absolute volatility is a measure of how much the annual return on the fund’s investments can normally be expected to fluctuate. This is calculated using standard deviation based on a three-year price history. The fund’s expected absolute volatility was 10.3 percent at the end of 2023, or about 1,620 billion kroner. In other words, the value of the fund can be expected to fluctuate by more than 1,620 billion kroner in one out of three years.
CHART 18 Expected absolute volatility for the fund. Percent (left-hand axis) and billions of kroner (right-hand axis).
Scenario analyses
Each year, we publish the results of analyses of a number of hypothetical scenarios. These scenarios may change from year to year to reflect market developments and events that could impact economic performance. Aspects of our scenario analyses from 2022 remain relevant, such as the consequences of a regional military conflict. The risk of this scenario is still present, but a lasting economic conflict could also lead to substantial losses for the fund. We have therefore included such a scenario in our latest report.
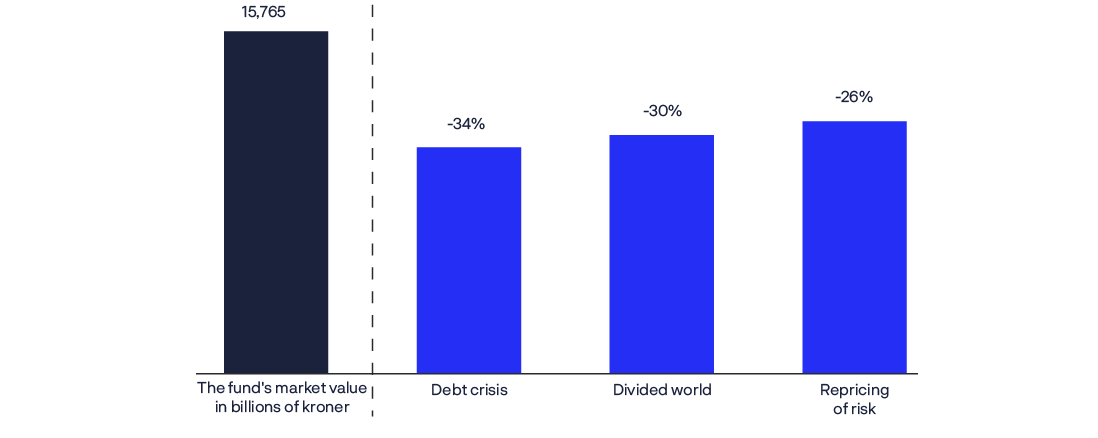
In 2023, we analysed three potential scenarios that could have a significant adverse impact on the fund’s value over time:
Debt crisis
High real interest rates and high public and private debt trigger a deep and long recession in both developed and emerging markets. This could hit the real estate sector particularly hard. High levels of debt limit governments’ ability to combat the recession.
Divided world
Tensions between countries increase, resulting in a protracted geoeconomic conflict. A splintering into two economic blocs leads to a persistent decrease in growth and higher inflation. Trade and capital flows between the two blocs decline permanently. Competition between the blocs means that investment in strategic sectors grows.
Repricing of risk
Equity risk premiums – or the compensation that investors receive for taking risk in the stock market – appears to be at historically low levels. Inflation does not come down, and central banks have to manage a difficult trade-off between stimulating economic growth and fighting inflation.
We analysed how these scenarios might affect the fund’s value and calculated potential losses over a period of up to five years. The equity market is vulnerable in all these scenarios. The sharp rise in real interest rates over the past two years means that the risk of losses on fixed-income investments has fallen.
A full report on this stress testing can be found on our website: www.nbim.no.
CHART 19 Estimated market value of the fund under each scenario and potential losses in percent.

Weaker return than the benchmark index
We aim to leverage the fund’s long-term investment horizon and considerable size to generate a high return with acceptable risk. In 2023, the fund’s return was 0.18 percentage point lower than the return on the benchmark index.
The return on the fund’s investments is measured against the return on the fund’s benchmark index from the Ministry of Finance, which is made up of global equity and bond indices. The equity portion of the benchmark index is based on the FTSE Global All Cap index and comprised 9,191 listed companies at the end of the year. The bond portion of the benchmark index is based on indices from Bloomberg Indices and comprised 17,565 bonds from 2,398 issuers.
At the end of 2023, the fund was invested in 8,859 listed companies and 6,378 bonds from 1,390 issuers. The fund also had investments in 897 unlisted properties and four investments in unlisted renewable energy infrastructure. To make all these investments in a way that contributes to the objective of the highest possible return after costs, we delegate the responsibility for individual investments to our portfolio managers through individual investment mandates. These mandates are awarded within the fund’s three main strategies: market exposure, security selection and fund allocation. A delegated mandate structure helps us build deep insight into selected market segments and companies. This insight puts us in a better position to be a responsible investor. At the end of 2023, we had 261 individual equity and bond mandates, of which 111 were assigned to external equity managers. This approach ensures precise management and control of risk, performance measurement, costs and incentives for each investment mandate.

The fund’s investments in real estate and unlisted renewable energy infrastructure are not part of the benchmark index from the Ministry. We sell equities and bonds in the benchmark index to fund investments in real estate and unlisted infrastructure. Which equities and bonds are sold depends on the country and currency in which the investment is made. The relative return for equity management and bond management is measured against the benchmark index adjusted for the equities and bonds sold to fund investments in real estate and unlisted renewable energy infrastructure. The return on real estate and infrastructure investments is measured against the equities and bonds sold to fund them.
The fund’s relative return
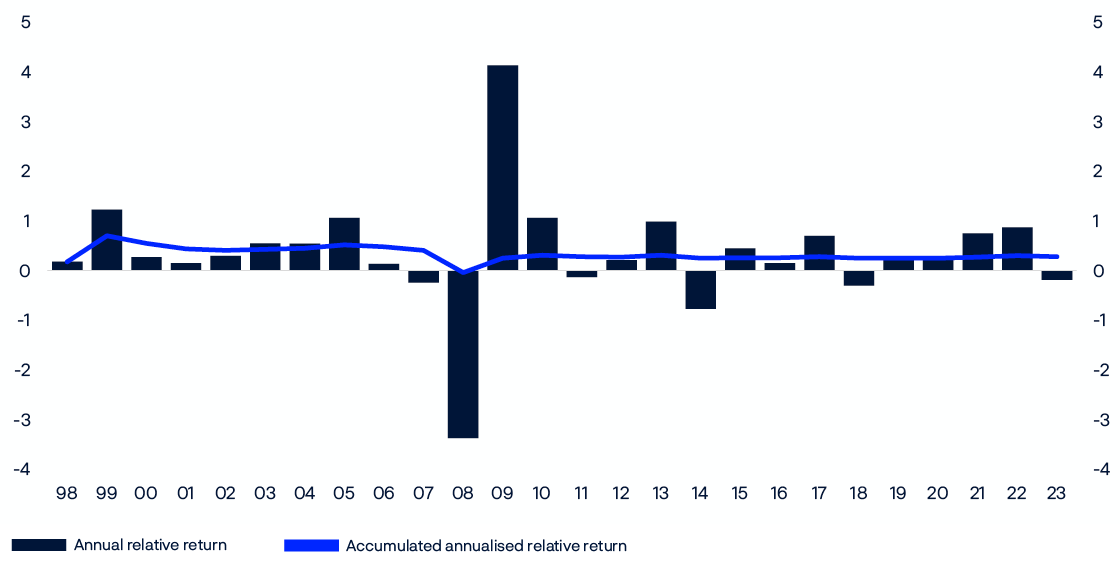
In 2023, the fund’s return was 0.18 percentage point lower than the return on the benchmark index1. The fund has outperformed the benchmark index by 0.28 percentage point annually since 1998, 0.22 percentage point over the past decade, and 0.42 percentage point over the past five years.
TABLE 18 Relative return in 2023.
|
Percentage points |
|
|---|---|
|
Fund |
-0.18 |
|
Equity investments |
0.50 |
|
Fixed-income investments |
0.48 |
CHART 20 The fund’s annual relative return and accumulated annualised relative return in percentage points. Calculations based on aggregated equity and fixed-income investments until end of 2016.
Equity management
Equity management is measured against the equity portion of the benchmark index, adjusted for sales of equities to fund investments in real estate and renewable energy infrastructure. The return on equity management was 0.38 percentage point higher than on this adjusted benchmark in 2023 and made a positive contribution of 0.25 percentage point to the fund’s total relative return. Investments in the financial and technology sectors contributed most to the relative return, while investments in consumer goods and energy made negative contributions. Broken down by country, investments in the US, Switzerland and the UAE contributed most to the relative return, while investments in Italy and Singapore made negative contributions.
Equity management has outperformed the benchmark index by 0.48 percentage point annually since 1999, 0.32 percentage point over the past decade, and 0.64 percentage point over the past five years.
Fixed-income management
Fixed-income management is measured against the bond portion of the benchmark index, adjusted for sales of bonds to fund investments in real estate and renewable energy infrastructure. The return on fixed-income management was 0.51 percentage point higher than on this adjusted benchmark in 2023 and contributed 0.14 percentage point to the fund’s relative return. Government bonds from Europe and emerging markets made the most positive contributions, while investments in corporate bonds made a negative contribution. Fixed-income management also had a lower duration than the benchmark in a year when interest rates rose, resulting in a positive contribution to the relative return.
Fixed-income management has outperformed the benchmark index by 0.24 percentage point annually since 1998, 0.29 percentage point over the past decade, and 0.64 percentage point over the past five years.

Real estate
We invest in real estate to improve the fund’s risk/return profile. The fund’s overall strategy for real estate covers both unlisted and listed real estate investments. The relative return for real estate management is the difference between the return on the fund’s total real estate investments and the return on the bonds and equities sold to buy them. Real estate management contributed -0.47 percentage point to the fund’s relative return in 2023. Unlisted real estate investments made a contribution of -0.58 percentage point. All markets had negative returns in 2023 other than Japan where there was a marginal positive return. The fund’s properties in the US made the greatest negative contribution, followed by those in France and Germany. Office properties in particular underperformed, but logistics and retail also made negative contributions. Listed real estate investments made a positive contribution to the relative return of 0.11 percentage point. Broken down by country, the US and Germany made the most positive contributions.
We report unlisted real estate returns quarterly and annually, but it is important to assess the real estate strategy over a longer period. From the fund’s first unlisted real estate investment in 2010 through to the end of 2016, the annual return on unlisted real estate investments was 5.98 percent. During this period, real estate investments were funded by selling bonds. The annual return on bond investments in the same period was 4.37 percent. The annual return on the real estate portfolio from 2017 to 2023 was 3.0 percent. During this period, unlisted real estate was funded through sales of equities as well as bonds. The annual return on this funding was 3.7 percent.
Unlisted renewable energy infrastructure
We invest in unlisted renewable energy infrastructure to improve the fund’s risk/return profile. The fund’s strategy focuses on building up a portfolio of large-scale high-quality wind and solar power generation assets. The relative return for renewable energy infrastructure is the difference between the return on the fund’s total investments in these assets and the return on the bonds sold to buy them. The fund’s investments in renewable energy infrastructure returned 1.2 percent in 2023 measured in euros. From inception, this strategy has produced an annual return of 6.7 percent measured in euros.
TABLE 19 Relative return on the fund's asset management in percentage points.
|
Year |
Fund1 |
Equity management2 |
Fixed-income management2 |
Real estate management2 |
Infrastructure management |
|---|---|---|---|---|---|
|
2023 |
-0.18 |
0.38 |
0.51 |
-10.51 |
-5.67 |
|
2022 |
0.87 |
0.52 |
1.68 |
0.22 |
25.09 |
|
20213 |
0.75 |
0.78 |
-0.04 |
7.36 |
8.04 |
|
2020 |
0.27 |
0.98 |
0.76 |
-13.81 |
|
|
2019 |
0.23 |
0.51 |
0.11 |
-3.89 |
|
|
2018 |
-0.30 |
-0.69 |
-0.01 |
5.49 |
|
|
2017 |
0.70 |
0.79 |
0.39 |
0.70 |
|
|
2016 |
0.15 |
0.15 |
0.16 |
||
|
2015 |
0.45 |
0.83 |
-0.24 |
||
|
2014 |
-0.77 |
-0.82 |
-0.70 |
||
|
2013 |
0.99 |
1.28 |
0.25 |
||
|
2012 |
0.21 |
0.52 |
-0.29 |
||
|
2011 |
-0.13 |
-0.48 |
0.52 |
||
|
2010 |
1.06 |
0.73 |
1.53 |
||
|
2009 |
4.13 |
1.86 |
7.36 |
||
|
2008 |
-3.37 |
-1.15 |
-6.60 |
||
|
2007 |
-0.24 |
1.15 |
-1.29 |
||
|
2006 |
0.14 |
-0.09 |
0.25 |
||
|
2005 |
1.06 |
2.16 |
0.36 |
||
|
2004 |
0.54 |
0.79 |
0.37 |
||
|
2003 |
0.55 |
0.51 |
0.48 |
||
|
2002 |
0.30 |
0.07 |
0.49 |
||
|
2001 |
0.15 |
0.06 |
0.08 |
||
|
2000 |
0.27 |
0.49 |
0.07 |
||
|
1999 |
1.23 |
3.49 |
0.01 |
||
|
1998 |
0.18 |
0.21 |
1Includes real estate management from 2017. The fund's relative return prior to 2017 is calculated on equity and fixed-income management only.
2Measured against actual funding from 2017. The relative return on equity and fixed-income management before 2017 is measured against the respective Ministry of Finance asset class indices.
3The relative return on the fund and fixed-income management for 2021 have been adjusted by 0.01 percentage point as a result of an update of the return on the benchmark index.
Investment strategies
We employ a range of investment strategies in our management of the fund. They are grouped into three main categories: market exposure, security selection and fund allocation. These strategies are pursued across equity, fixed-income and real asset management.
Market exposure strategies consist of positioning and securities lending, and contributed 0.16 percentage point to the fund’s relative return in 2023. Positioning is about implementing market exposures in ways that increase investment returns and reduce transaction costs for the fund. The strategy aims to exploit relative valuations across instruments and issuers, the pricing effects of corporate and market events, and positioning in relation to developments in fixed-income markets, including interest rate levels, inflation, exchange rates and interest rate differentials between countries. Equity positioning contributed 0.02 percentage point to the relative return for 2023, the main contributors being Chinese stocks. Investments in the US and developed markets in Asia made negative contributions. Bond positioning contributed 0.10 percentage point to the fund’s relative return, with positive contributions from all regions. Securities lending contributed 0.04 percentage point to the fund’s relative return, most of which came from loans of equities.
Security selection strategies use deep insights into the fund’s largest investments provided by company analysis to enhance returns and support the fund’s work as a responsible and active owner. Positions under these strategies contributed 0.18 percentage point to the fund’s relative return in 2023. Internal equity selection contributed 0.10 percentage point, with investments in financials and technology making particularly positive contributions, and investments in consumer durables the most negative contribution. External equity selection contributed 0.11 percentage point to the relative return, with a positive contribution from emerging markets in every region, and a negative contribution from developed markets.
When it comes to fixed-income management, security selection focuses on corporate bonds. This strategy contributed -0.03 percentage point to the fund’s relative return, with credit positioning making a positive contribution, and issuer selection a negative contribution.
Fund allocation consists of a number of strategies that aim to improve the trade-off between return and risk in the fund. These strategies contributed -0.53 percentage point to the fund’s relative return in 2023.

Investments in real estate and renewable energy infrastructure are reported under fund allocation in our strategy reporting. Investments in real estate contributed -0.47 percentage point to the fund’s relative return in 2023, and investments in renewable energy infrastructure -0.01 percentage point.
In 2023, the fund was underweight in equities and overweight in bonds, and overweight in emerging-market bonds. The bond portfolio also had a lower duration than the benchmark index throughout the year. Taken together, allocation decisions of this kind made a contribution of -0.05 percentage point to the relative return.
TABLE 20 Contributions to the fund's relative return from investment strategies in 2023. In percentage points.
|
Equity management |
Fixed-income management |
Real assets management |
Allocation |
Total |
|
|---|---|---|---|---|---|
|
Market exposure |
0.06 |
0.10 |
0.00 |
0.16 |
|
|
Asset positioning |
0.02 |
0.10 |
0.00 |
0.12 |
|
|
Securities lending |
0.03 |
0.01 |
0.04 |
||
|
Security selection |
0.21 |
-0.03 |
0.18 |
||
|
Internal security selection |
0.10 |
-0.03 |
0.07 |
||
|
External security selection |
0.11 |
0.11 |
|||
|
Fund allocation |
-0.02 |
0.07 |
-0.48 |
-0.10 |
-0.53 |
|
Real estate |
-0.47 |
-0.47 |
|||
|
Unlisted real estate |
-0.58 |
-0.58 |
|||
|
Listed real estate |
0.11 |
0.11 |
|||
|
Renewable energy infrastructure |
-0.01 |
-0.01 |
|||
|
Allocation |
-0.02 |
0.07 |
-0.10 |
-0.05 |
|
|
Total |
0.25 |
0.14 |
-0.48 |
-0.10 |
-0.18 |
TABLE 21 Contributions to the fund's relative return from investment strategies annualised for 2013–2023. In percentage points.
|
Equity management |
Fixed-income management |
Real assets management |
Allocation |
Total |
|
|---|---|---|---|---|---|
|
Market exposure1 |
0.11 |
0.07 |
0.00 |
0.18 |
|
|
Asset positioning |
0.07 |
0.07 |
0.00 |
0.14 |
|
|
Securities lending |
0.04 |
0.01 |
0.05 |
||
|
Security selection |
0.16 |
0.01 |
0.17 |
||
|
Internal security selection |
0.07 |
0.01 |
0.08 |
||
|
External security selection |
0.09 |
0.09 |
|||
|
Fund allocation |
0.00 |
-0.01 |
-0.06 |
0.00 |
-0.06 |
|
Real estate |
-0.06 |
-0.06 |
|||
|
Unlisted real estate |
0.00 |
0.00 |
|||
|
Listed real estate |
-0.05 |
-0.05 |
|||
|
Renewable energy infrastructure |
0.00 |
0.00 |
|||
|
Allocation2,3 |
0.00 |
-0.01 |
0.00 |
0.00 |
-0.01 |
|
Total |
0.26 |
0.07 |
-0.06 |
0.01 |
0.29 |
1 Market exposure includes -0.01 percentage point from the systematic factors strategy which was ended in the second quarter of 2020.
2Regulations for Environmental related mandates for equities and fixed income were changed by the Ministry of Finance during 2022. The historic performance impact from Environmental related mandates until 2022 is included under Allocations.
3Specific allocation to Systematic factors was ended in 2022. The historic performance impact from Systematic factors is included under Allocations.
Risk relative to the benchmark index
The fund is invested differently to its benchmark index along various dimensions, including asset classes, currencies, sectors, countries, regions, individual stocks and individual bond issuers.
At the end of 2023, the equity portfolio was overweight in high-volatility stocks and a number of growth segments, including stocks with low dividend yields. The fixed-income portfolio had less exposure to corporate bonds than the benchmark index, but greater exposure to bonds from emerging markets and government-related bonds. The fund also had 301 billion kroner invested in unlisted real estate and an allocation to listed real estate investments of 309 billion kroner at the end of 2023. Real estate investments were among the fund’s largest relative exposures at year-end.

The Ministry of Finance and Norges Bank’s Executive Board have set limits for how far the fund’s investments may deviate from the benchmark index.
One of these limits is for expected relative volatility, or tracking error, and puts a ceiling on how much the return on the fund’s investments can be expected to deviate from the return on the benchmark index. The management mandate requires all of the fund’s investments to be included in the calculation of expected relative volatility and measured against the fund’s benchmark index, which consists solely of global equity and bond indices. The fund is to aim for expected relative volatility of no more than 1.25 percentage points. The actual level at the end of the year was 0.34 percentage point, down from 0.39 percentage point at the end of 2022. The decrease was due mainly to a lower expected relative volatility for real estate investments.
The fund invests in real estate to create a more diversified portfolio. We expect real estate investments to have a different return profile to equities and bonds in both the short and the longer term. The relative risk that this entails will impact on calculations of the fund’s expected relative volatility. As daily pricing is not available for our unlisted real estate investments, we use a model from MSCI to calculate the relative risk for these investments.
Norges Bank’s Executive Board has also set a limit for expected shortfall for the relative return between the fund and the benchmark index. The fund is to be managed in such a way that the expected negative relative return in extreme situations does not exceed 3.75 percentage points. The actual figure was 1.08 percentage points at the end of the year, down from 1.22 percentage points at the end of 2022.
TABLE 22 Key figures for the fund's risk and exposure.
|
Limits set by the Ministry of Finance |
31.12.2023 |
|
|---|---|---|
|
Allocation |
Equity portfolio 60–80 percent of fund's market value1 |
70.8 |
|
Unlisted real estate no more than 7 percent of the fund's market value |
1.9 |
|
|
Fixed-income portfolio 20–40 percent of fund's market value1 |
28.6 |
|
|
Unlisted renewable energy infrastructure no more than 2 percent of the fund's market value |
0.1 |
|
|
Market risk |
1.25 percentage points expected relative volatility for the fund's investments |
0.3 |
|
Credit risk |
Maximum 5 percent of fixed-income investments may be rated below BBB- |
1.1 |
|
Emerging markets |
Maximum 5 percent of fixed-income investments may be in emerging markets |
2.7 |
|
Ownership |
Maximum 10 percent of voting shares in a listed company in the equity portfolio2 |
9.6 |
1Derivatives are represented with their underlying economic exposure.
2Investments in listed and unlisted real estate companies are exempt from this restriction.
CHART 21 Expected relative volatility of the fund in basis points.
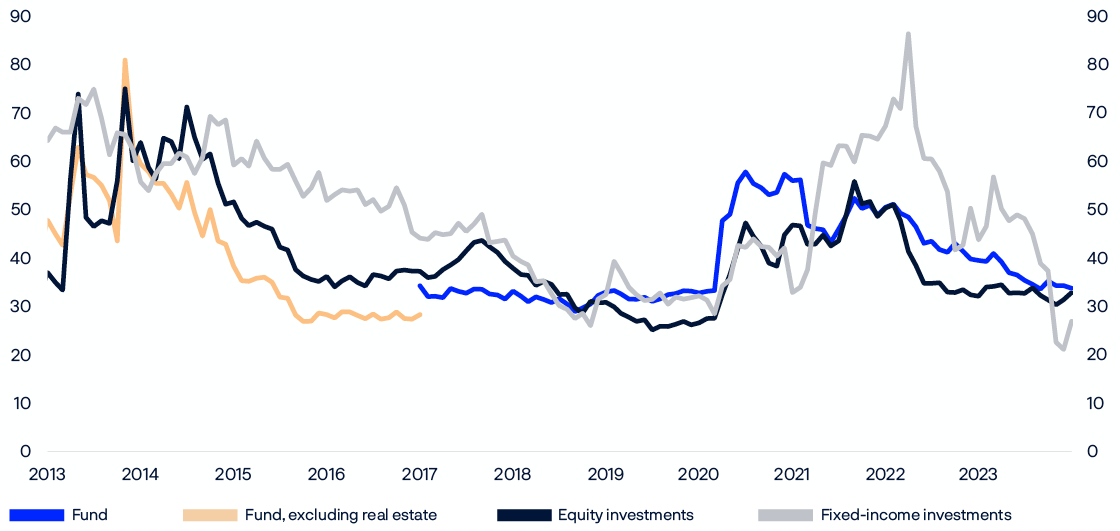
TABLE 23Expected relative volatility of investment strategies as at 31 December 2023. Each strategy measured stand-alone with the other strategies positioned in line with the benchmarks. All numbers measured at fund level in basis points.
|
Equity management |
Fixed-income management |
Real assets management |
Allocation |
Total |
|
|---|---|---|---|---|---|
|
Market exposure |
4 |
2 |
0 |
5 |
|
|
Asset positioning |
4 |
2 |
0 |
5 |
|
|
Security selection |
16 |
2 |
16 |
||
|
Internal security selection |
12 |
2 |
12 |
||
|
External security selection |
7 |
7 |
|||
|
Fund allocation |
6 |
4 |
34 |
9 |
34 |
|
Real estate |
34 |
34 |
|||
|
Unlisted real estate |
18 |
18 |
|||
|
Listed real estate |
23 |
23 |
|||
|
Renewable energy infrastructure |
4 |
4 |
|||
|
Allocation |
6 |
4 |
9 |
13 |
|
|
Total |
17 |
6 |
34 |
9 |
34 |

1From 2019 to 2022, the fund recognised a provision for future tax obligations relating to capital gains in India which was not included in the benchmark index. From 2023 onwards, this provision is not included in the fund’s market value. This change affected the relative return for 2023 by 4,488 million kroner. Viewed over the period from 2019 to 2023, however, these provisions had no impact on the relative return.
Responsible investment report
The fund’s work on responsible investment is presented in a separate report available on our website: www.nbim.no.


Our people are the heart of our business
Our people are our most important asset. We aim to attract, develop and retain leading talent. We aim to ensure that everyone can work efficiently and innovatively and has the skills to take on new challenges.

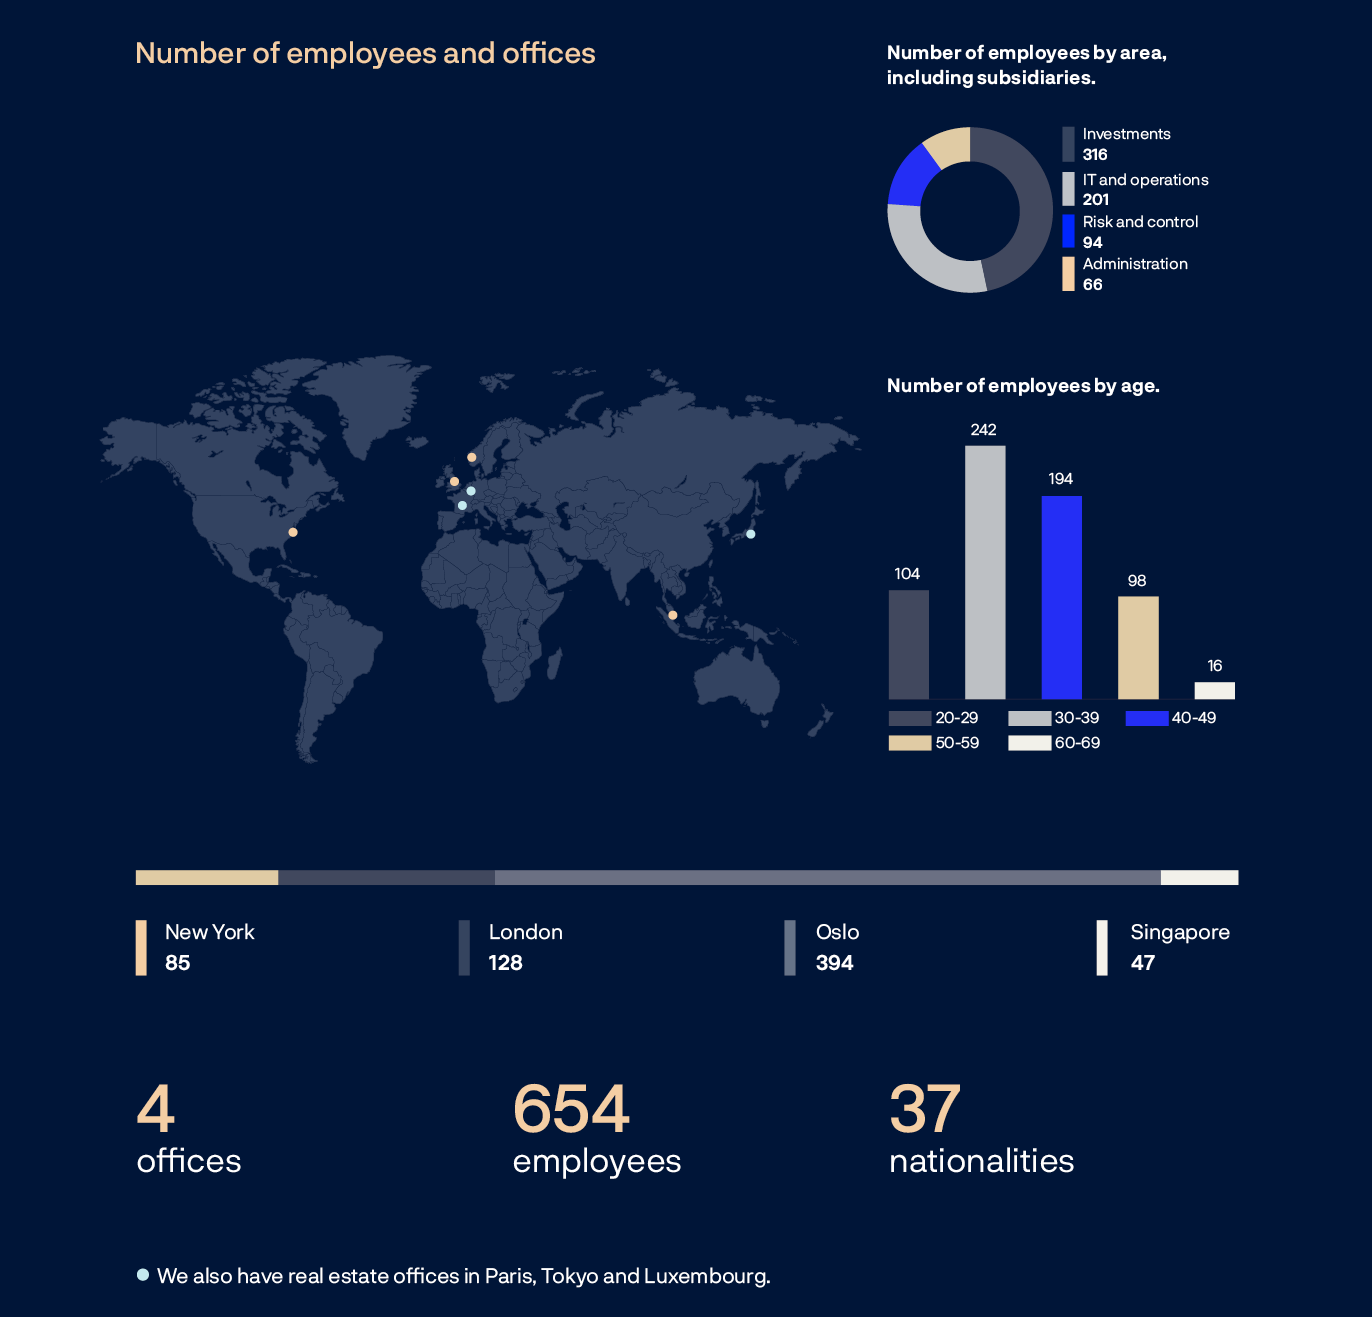
We are a global investment organisation. At the end of 2023, we had 654 employees across our offices in Oslo, London, New York and Singapore. We also have real estate offices in Paris, Luxembourg and Tokyo. Close collaboration across these offices is essential for achieving the fund’s objective of the highest possible return.
We decided in autumn 2023 to close our representative office in Shanghai. The Singapore office has been built up gradually to take care of all operational functions, including investments in China.
Learning and development opportunities
We believe in lifelong learning and give employees the chance to build relevant skills throughout their careers. We work systematically on developing managers and employees, offering a variety of learning and development opportunities.
In 2023, we launched our improved performance management process THRIVE where employees reflect on their performance and set targets for the year ahead. The aim is to promote professional development and increase interaction between managers, teams and individuals. We have clear expectations for all managers and employees.
We arrange regular physical and digital meet-ups for managers, and launched an induction programme for all new managers in 2023. Giving and receiving feedback is one of our core competencies. We believe that this brings personal and professional development at all career stages. Each year, managers carry out a 360 review where they gather feedback from their colleagues to help them develop further in their role.
We launched our own Investment Academy during the year to boost investment skills, value chain understanding and collaboration across the organisation through sessions with internal experts. In collaboration with Rystad Energy Institute, we arranged a lecture series on the energy transition and renewable energy for the entire organisation. For the first time, we arranged hackathons at all our offices. The aim was to explore the use of AI and understand how this technology can help us be more efficient.
We launched our own learning platform during the year with digital courses tailored to our organisation. We also offer more than 7,000 courses from leading universities and organisations.
Our 2023 people survey showed strong engagement among our employees. They are happy with their employer, they feel that their work is meaningful, and they are proud to work for Norges Bank Investment Management across gender, age and nationality.
Information and recruitment
We are keen to give young people a better understanding of the world of finance. In 2023, we gave 19 guest lectures at universities in Norway and abroad. The aim was to give students an insight into investment management in practice, increase knowledge about the fund and share our expertise with a younger target group so that more apply to work for us.
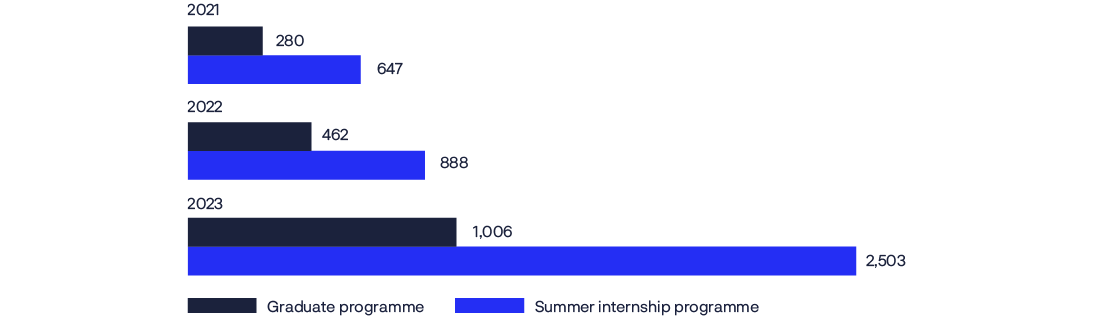
We work systematically to recruit the best candidates both in Norway and internationally. We seek talented individuals with varied skills and backgrounds. We saw a significant increase in the number of applicants for our vacancies from 2022 to 2023, including record-high applications for our graduate and summer internship programmes.
CHART 22 Number of applications for our graduate and summer internship programmes.

Diversity and inclusion
We aim to be an inclusive organisation with a diversity of mindsets, ethnicities, age groups, academic backgrounds and life experience. This brings a broader perspective, increases creativity and leads to better decisions.
We are working actively to increase the share of women in the organisation as a whole and in management positions. Norges Bank signed the Women in Finance Charter in 2021 and hosted the charter’s second status report in 2023. Our obligations under the charter’s four principles can be found on our website. We also have our own networks for female employees.
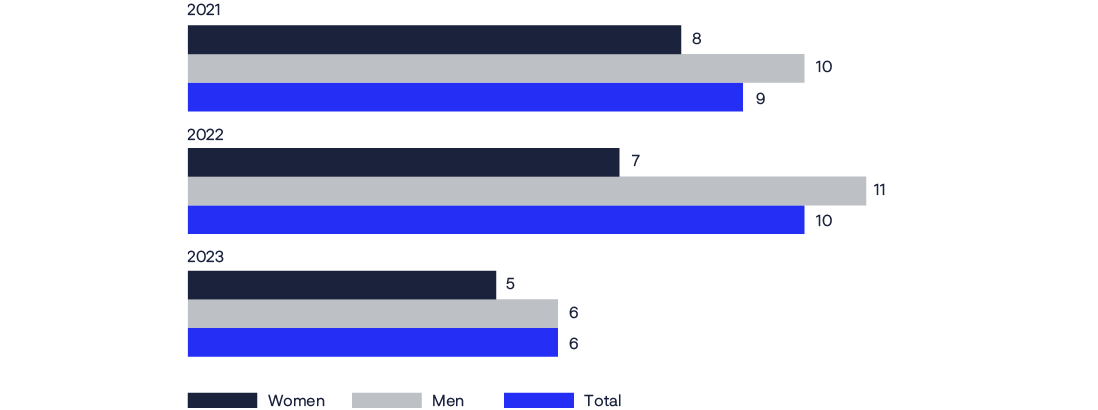
Our continuous efforts to increase the share of women have yielded positive results, partly through better retention of female employees.
CHART 23 Employees who ended their employment, by gender in percent.
To ensure that we are consistent and fair in our approach to employees’ progression, promotion and remuneration, different areas of the organisation have their own career ladders. Each ladder can have up to five different grades with consistent job titles. Each grade reflects the expectations associated with the role that are to be met regardless of which area the employee works in. For example, a portfolio manager in Market Strategies, a senior adviser in Risk Management and a technical expert in Technology & Operations are considered to be the same grade in terms of capability, responsibility and behaviour.
CHART 24 Share of employees, managers and new hires who are women, in percent.
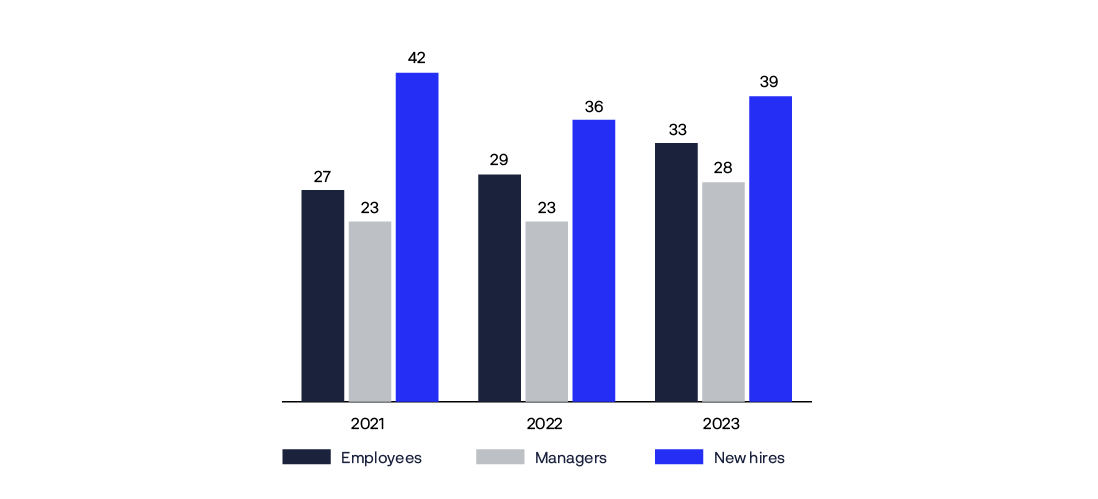
CHART 25 Share of employees, managers and new hires who are non-Norwegian, in percent.
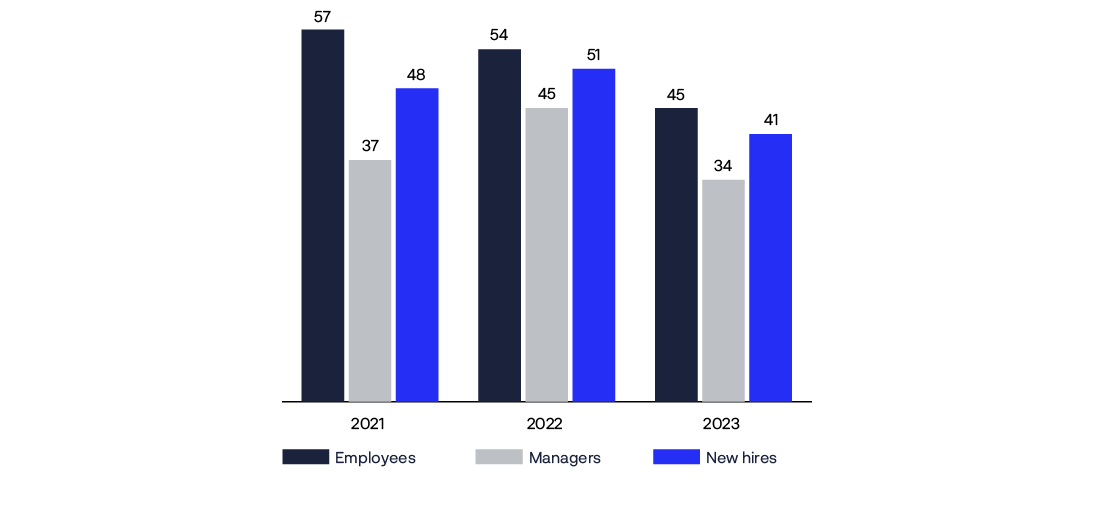
TABLE 24 Gender balance by grade and office as at 31 December 2023. In percent.
|
Grade |
Oslo |
London |
New York |
Singapore |
||||
|---|---|---|---|---|---|---|---|---|
|
Share of employees |
Share of employees |
Share of employees |
Share of employees |
|||||
|
Men |
Women |
Men |
Women |
Men |
Women |
Men |
Women |
|
|
Global Head |
91 |
9 |
80 |
20 |
100 |
0 |
||
|
Head |
63 |
38 |
69 |
31 |
90 |
10 |
100 |
0 |
|
Level 5 |
100 |
0 |
100 |
0 |
60 |
40 |
||
|
Level 4 |
79 |
21 |
76 |
24 |
81 |
19 |
63 |
38 |
|
Level 3 |
63 |
37 |
56 |
44 |
67 |
33 |
78 |
22 |
|
Level 2 |
67 |
33 |
35 |
65 |
80 |
20 |
57 |
43 |
|
Level 1 |
53 |
47 |
40 |
60 |
100 |
0 |
50 |
50 |
Remuneration system
Norges Bank’s Executive Board sets limits for our remuneration system and monitors its implementation. Pay levels are to be competitive but generally not market-leading. Salaries are set individually and reflect the position’s responsibilities and the employee’s skills, experience and achievements. Total remuneration paid includes fixed salary and any performance-based pay and overtime payments.
In keeping with management mandate from the Ministry of Finance, the remuneration system complies with the requirements of the regulations issued under the Securities Funds Act with necessary adjustments. The Executive Board’s Remuneration Committee is to contribute to thorough and independent consideration of matters concerning Norges Bank’s remuneration arrangements. Norges Bank’s Internal Audit unit also issues an independent statement on compliance with rules and guidelines on remuneration. The review in 2023 confirmed that the remuneration system was operated in line with applicable rules in 2022. There were no significant changes to the remuneration system during the year.

Members of the leader group receive only a fixed salary. The CEO’s salary and pay bands for other members of the leader group are set by the Executive Board.
TABLE 25Fixed salary and other key information for senior management in 2023.
|
Position |
Name |
Gender |
Investment area |
Age |
Tenure in Norges Bank Investment Management |
Annual fixed salary in kroner |
|---|---|---|---|---|---|---|
|
Chief Human Resources Officer |
Aass, Ada Magnæs1 |
Woman |
44 years |
9 years |
2,300,000 |
|
|
Co-Chief Investment Officer Equities |
Balthasar, Daniel2 |
Man |
Investment area |
47 years |
17 years |
12,068,000 |
|
Chief Technology and Operating Officer |
Bryne, Birgitte |
Woman |
51 years |
8 years |
4,010,000 |
|
|
Co-Chief Investment Officer Equities |
Furtado Reis, Pedro2 |
Man |
Investment area |
48 years |
12 years |
12,068,000 |
|
Deputy Chief Executive Officer/Chief of Staff |
Grande, Trond |
Man |
53 years |
16 years |
5,225,000 |
|
|
Chief Investment Officer Real Assets |
Holstad, Mie Caroline |
Woman |
Investment area |
41 years |
13 years |
3,415,000 |
|
Chief Risk Officer |
Huse, Dag |
Man |
57 years |
20 years |
4,860,000 |
|
|
Chief Governance and Compliance Officer |
Ihenacho, Carine Smith2 |
Woman |
61 years |
6 years |
5,859,000 |
|
|
Co-Chief Investment Officer Asset Strategies |
Norberg, Malin1 |
Woman |
Investment area |
39 years |
14 years |
4,300,000 |
|
Co-Chief Investment Officer Asset Strategies |
Nygård, Geir Øivind |
Man |
Investment area |
43 years |
16 years |
4,750,000 |
|
Chief Communications and External Relations Officer |
Skaar, Marthe1 |
Woman |
40 years |
10 years |
1,950,000 |
|
|
Chief Executive Officer |
Tangen, Nicolai |
Man |
57 years |
3 years |
7,160,000 |
1 Member of Norges Bank Investment Management's leader group from 1 April 2023.
2 Receives a salary in pounds sterling. The amount shown includes the currency effect when translating into kroner.
TABLE 26 Remuneration of senior management in 2023. In kroner.
|
Position |
Name |
Paid salary |
Performance-based pay |
Value of other benefits4 |
Pension benefit earned |
Employee loan |
|---|---|---|---|---|---|---|
|
Chief Human Resources Officer |
Aass, Ada Magnæs1 |
1,711,965 |
7,261 |
274,828 |
||
|
Co-Chief Investment Officer Equities |
Balthasar, Daniel2,3 |
12,030,505 |
3,585,764 |
172,149 |
1,203,051 |
|
|
Chief Technology and Operating Officer |
Bryne, Birgitte |
3,964,247 |
16,555 |
437,723 |
||
|
Co-Chief Investment Officer Equities |
Furtado Reis, Pedro2,3 |
12,030,505 |
3,475,348 |
168,777 |
1,203,051 |
|
|
Deputy Chief Executive Officer/Chief of Staff |
Grande, Trond |
5,199,029 |
9,156 |
409,556 |
||
|
Chief Investment Officer Real Assets |
Holstad, Mie Caroline |
3,380,174 |
12,341 |
346,309 |
||
|
Chief Risk Officer |
Huse, Dag |
4,842,036 |
9,156 |
668,627 |
||
|
Chief Governance and Compliance Officer |
Ihenacho, Carine Smith3 |
5,800,948 |
155,701 |
580,095 |
||
|
Co-Chief Investment Officer Asset Strategies |
Norberg, Malin1 |
3,135,222 |
15,849 |
253,896 |
1,162,102 |
|
|
Co-Chief Investment Officer Asset Strategies |
Nygård, Geir Øivind |
4,732,467 |
16,091 |
319,435 |
||
|
Chief Communications and External Relations Officer |
Skaar, Marthe1 |
1,467,748 |
15,077 |
262,270 |
||
|
Chief Executive Officer |
Tangen, Nicolai |
7,141,040 |
18,472 |
382,856 |
1 Started in the position 1 April 2023. Remuneration is shown from the employment date.
2 Members of the Norges Bank Investment Management leader group only receive a fixed salary. Members of the leader group that previously were entitled to performance-based pay are
no longer a part of this arrangement, but over the coming years will receive accrued performance-based pay that has been held back. The amounts reported in the table are performance-based pay disbursed during the financial year, but accrued and expensed in earlier periods.
3 Receives a salary in pounds sterling. The amount shown includes the currency effect when translating into kroner.
4 Consist mainly of electronic communication tools, personnel insurance and certain travel costs.
In 2023, a total of 1,109 million kroner was paid in fixed salaries to 738 employees: 65 million kroner to senior management, 509 million to employees entitled to performance-based pay and 534 million kroner to other employees.
Fixed salary at subsidiaries
A total of 41 million kroner was paid in fixed salaries to 24 employees of subsidiaries linked to the management of the real estate portfolio, of which 20 million kroner to employees entitled to performance-based pay and 22 million kroner to other employees.
Performance-based pay
In addition to their fixed salary, those who work directly on investment decisions may qualify for performance-based pay. This is calculated on the basis of the performance of the fund, group and individual measured against agreed qualitative and quantitative targets. Qualitative targets may include aspects of environmental, social and governance (ESG) performance. Results are measured over a period of at least two years.

The limit for performance-based pay is generally a maximum of 100 percent of fixed salary. For a limited number of employees at the overseas offices, however, the limit may be 200 percent of fixed salary. Employees eligible for performance-based pay accrued an average of 61 percent of the overall limit for 2023 based on multi-year performance. In 2023, a total of 300 million kroner was paid in performance-based pay to 225 employees.
Performance-based pay is paid over a number of years. Around half is paid the year after it is accrued, while the remainder is held back and paid over the following three years. The amount held back is adjusted according to the return on the fund.
Performance-based pay at subsidiaries
11 million kroner in performance-based pay was paid to nine employees at subsidiaries, associated with the management of the real estate portfolio.
CHART 26 Performance-based pay relative to upper limit in 2023. Percentage of employees entitled to performance-based pay.
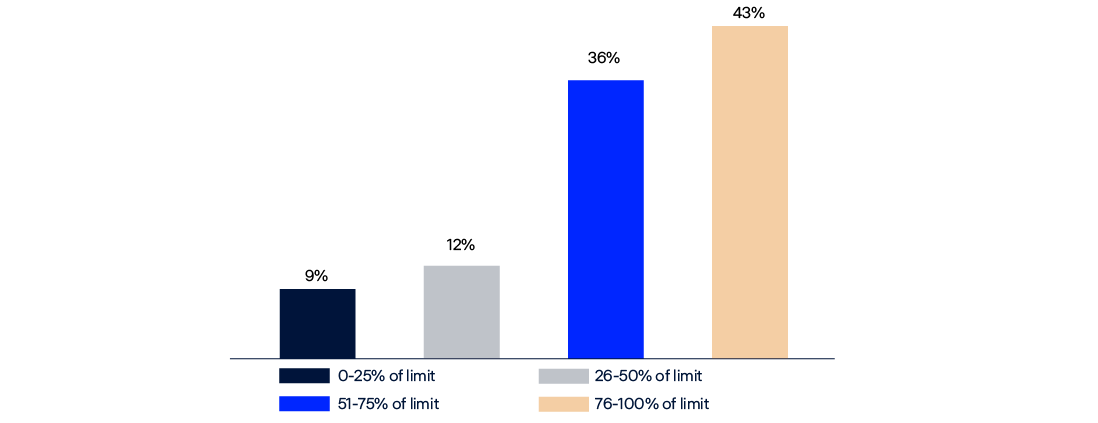
Equal pay
To ensure fair remuneration practices, we regularly analyse developments in our employees’ pay. Any significant discrepancies at the level of the individual or group are investigated further to ensure that gender-neutral criteria have been applied.
Our analyses show that comparable positions and duties attract equal pay. Pay gaps between women and men are due to men being over-represented in positions working on investment decisions. Positions with investment responsibilities are generally better paid in the market than positions at the same grade in other areas. A larger share of men at senior grades also contributes to differences at the level of the organisation.
TABLE 27Unadjusted pay gap between women and men in percent.1
|
Fixed salary |
Expected remuneration paid |
|||
|---|---|---|---|---|
|
Median |
Average |
Median |
Average |
|
|
Oslo office |
88.3 |
88.2 |
86.4 |
80.4 |
|
Total |
81.9 |
78.6 |
73.6 |
68.1 |
1 Unadjusted pay gap between women and men reflects the disparity in earnings without adjusting for factors such as working hours, occupation, age, experience, education level, or other variables that could impact total pay gaps.
TABLE 28Salary analysis of men and women compared to their peer group by 31 December 2023. Each employee's salary is compared to the average and median salaries in their peer group.1
|
Job function |
Salary compared to average of peer group in percent |
Salary compared to median of peer group in percent |
Number of employees |
Share of women in percent |
Average age, women |
Average age, men |
||
|---|---|---|---|---|---|---|---|---|
|
Women |
Men |
Women |
Men |
|||||
|
Portfolio management and trading |
98 |
101 |
99 |
102 |
183 |
21 |
37 |
42 |
|
Portfolio management and trading support |
96 |
102 |
97 |
102 |
52 |
40 |
31 |
37 |
|
Governance and compliance, legal, risk and legal functions |
99 |
100 |
99 |
103 |
137 |
47 |
40 |
42 |
|
Communications and external relations, HR, staff |
101 |
99 |
101 |
99 |
71 |
63 |
44 |
40 |
|
Technology and operations |
97 |
101 |
99 |
102 |
199 |
20 |
39 |
39 |
|
Total |
99 |
101 |
99 |
102 |
642 |
33 |
39 |
40 |
1 Analysis based on employees' fixed salaries and expected annual accrual of the overall limit for performance-based pay. The leader group is not included in this analysis.
TABLE 29 Salary analysis of Norwegian and non-Norwegian employees compared to their peer group as at 31 December 2023. employee's salary is compared to the average and median salaries in their peer group.1
|
Job function |
Salary compared to average of peer group in percent |
Salary compared to median of peer group in percent |
Number of employees |
Share of non-Norwegian employees in percent |
Average age, non-Norwegian employees |
Average age, Norwegian employees |
||
|---|---|---|---|---|---|---|---|---|
|
Non-Norwegian employees |
Norwegian employees |
Non-Norwegian employees |
Norwegian employees |
|||||
|
Portfolio management and trading |
100 |
100 |
101 |
102 |
183 |
49 |
42 |
41 |
|
Portfolio management and trading support |
99 |
101 |
99 |
101 |
52 |
54 |
34 |
35 |
|
Governance and compliance, legal, risk and legal functions |
101 |
99 |
100 |
102 |
137 |
44 |
41 |
40 |
|
Communications and external relations, HR, staff |
101 |
100 |
101 |
100 |
71 |
38 |
45 |
41 |
|
Technology and operations |
98 |
101 |
100 |
102 |
199 |
45 |
38 |
39 |
|
Total |
100 |
100 |
100 |
102 |
642 |
46 |
40 |
40 |
1 Analysis based on employees' fixed salaries and expected annual accrual of the overall limit for performance-based pay. The leader group is not included in this analysis.
For data protection reasons, there must be at least five members of each gender at each grade for pay data to be published.
TABLE 30Fixed salary by grade at the Oslo office as at 31 December 2023.
|
Grade |
Number of employees |
Median fixed salary in kroner |
Women's as a percentage of men's |
Mean fixed salary in kroner |
Women's as a percentage of men's |
|||
|---|---|---|---|---|---|---|---|---|
|
Men |
Women |
Men |
Women |
Men |
Women |
|||
|
Head |
25 |
15 |
1,540,000 |
1,540,000 |
100 |
1,614,000 |
1,560,000 |
97 |
|
Level 4 |
64 |
17 |
1,383,000 |
1,370,000 |
99 |
1,456,000 |
1,376,000 |
95 |
|
Level 3 |
84 |
49 |
1,055,000 |
1,050,000 |
100 |
1,077,000 |
1,090,000 |
101 |
|
Level 2 |
48 |
24 |
818,000 |
808,000 |
99 |
837,000 |
807,000 |
96 |
|
Level 1 |
16 |
14 |
638,000 |
625,000 |
98 |
642,000 |
640,000 |
100 |
TABLE 31 Total remuneration paid by grade at the Oslo office as at 31 December 2023.
|
Grade |
Number of employees |
Median total remuneration paid in kroner |
Women's as a percentage of men's |
Mean total remuneration paid in kroner |
Women's as a percentage of men's |
|||
|---|---|---|---|---|---|---|---|---|
|
Menn |
Kvinner |
Menn |
Kvinner |
Menn |
Kvinner |
|||
|
Head |
25 |
15 |
1,700,000 |
1,572,000 |
92 |
1,732,000 |
1,608,000 |
93 |
|
Level 4 |
64 |
17 |
1,625,000 |
1,450,000 |
89 |
1,785,000 |
1,504,000 |
84 |
|
Level 3 |
84 |
49 |
1,108,000 |
1,130,000 |
102 |
1,176,000 |
1,137,000 |
97 |
|
Level 2 |
48 |
24 |
838,000 |
818,000 |
98 |
859,000 |
835,000 |
97 |
|
Level 1 |
16 |
14 |
643,000 |
643,000 |
100 |
645,000 |
647,000 |
100 |
Operational risk
Norges Bank’s Executive Board sets limits for operational risk management and internal controls at Norges Bank Investment Management. We work systematically to identify operational risks and improve our processes.

The Executive Board has decided there must be less than a 20 percent probability that operational risks result in gains and losses totalling 1 billion kroner or more over a 12-month period. This is referred to as the Executive Board’s operational risk tolerance.
Unwanted incidents in 2023
We registered 173 unwanted incidents in 2023, down from 295 in 2022. The majority had no financial consequences. Altogether, these unwanted incidents had an estimated financial impact of 1.2 billion kroner.
One of these incidents was considered critical and accounted for most of the financial impact. The impact was due to an error that was discovered in our calculation of the currency allocation in the government bond portion of the Ministry of Finance’s benchmark index for the bond portfolio as a result of the wrong data being used. Five incidents were classified as significant and had direct financial consequences, accounting for around 221 million kroner of the total financial impact. These incidents were related to internal portfolio management, availability of systems to handle orders, delays in order processing, and a minor misclassification of financial transactions.
Compliance with guidelines
The Ministry of Finance has issued a mandate for the management of the Government Pension Fund Global. One material breach of the mandate was registered in 2023 and the Ministry was duly informed. We did not receive any notifications from local supervisory authorities of any significant breaches of market rules or general legislation during the year.
CHART 27 Unwanted events at Norges Bank Investment Management by cause.
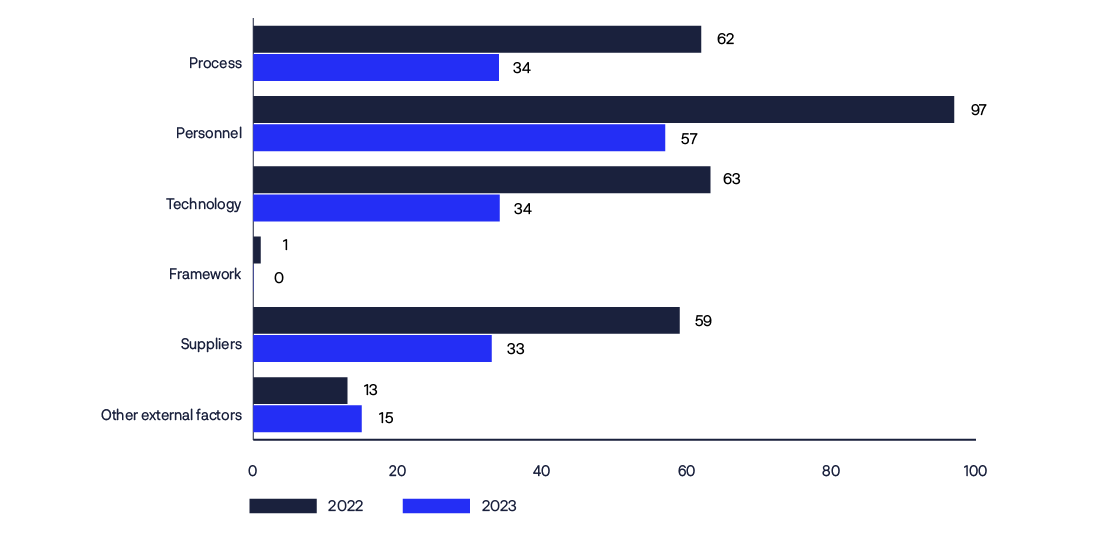
Cyber risk
With increased geopolitical tensions and ever more sophisticated cyber criminals, information security represents a significant risk for Norges Bank Investment Management. Both cyber criminals and state-sponsored actors continue to adapt and evolve new means of attack. The mass adoption of AI will continue to lower the barrier for criminals to develop sophisticated malware and enhance their ability to manipulate victims through social engineering. The general emergence of private-sector offensive actors (“hackers for hire”) puts sophisticated cyber capabilities in the hands of any state or corporation interested in spying on us. Multiple processes and controls are in place to help mitigate these risks throughout the life cycle of our information and IT assets. There were no significant information security incidents at Norges Bank Investment Management in 2023.
Reputation
We manage the fund on behalf of the Norwegian people. The fund is the single largest investor in many listed companies. We rely on the trust of the Norwegian people and international financial markets. We work on protecting and strengthening our reputation in various ways, for example by ensuring compliance with laws and guidelines and through a code of conduct setting out ethical rules for all employees.
We also attach importance to being transparent, communicating with the fund’s owners and maintaining a dialogue with the companies we invest in. We respond to all enquiries from the media and the public. Every two years, consulting firm Kantar gauges the fund’s reputation among the Norwegian populace on behalf of Norges Bank Investment Management. The most recent survey in 2022 shows that the fund has a good reputation.

In 2023, we were crowned the world’s most transparent investment fund according to the Global Pension Transparency Benchmark (GPTB) developed by CEM Benchmarking and Top1000funds.com. The results rank 75 funds from 15 countries on costs, governance, performance and responsible investment. The GPTB is the world’s first standard for measuring transparency among pension funds and other institutional investment funds worldwide.
Low costs
We maintain a high level of cost awareness in our management of the fund and work continually to automate processes and streamline operations to realise economies of scale.

We place emphasis on high returns, responsible investment and transparency as important priorities for the fund. We continue to exploit the fund’s characteristics as a large and long-term investor, in order to achieve the highest possible return in a responsible manner. At the same time, we want to ensure cost efficiency without compromising operational robustness, good risk management in the face of increased global uncertainty and a more complex risk situation, and the opportunity to create added value in the fund’s management.
Internal management costs as a share of assets under management have fallen in recent years. We strive continuously to increase operational efficiency and realise economies of scale, and several large initiatives have been carried out at Norges Bank Investment Management to contribute to this. The management of the fund should be cost-efficient, but low costs are not a goal in themselves. The fund’s objective as set out in the management mandate from the Ministry of Finance is to seek to generate the highest possible return, net of costs, measured in the currency basket of the investment portfolio, within the applicable investment management framework.
The fund’s management costs measured as a share of assets under management are low compared to other funds. Management costs in Norges Bank amounted to 0.045 percent of assets under management in 2023. An annual report prepared by CEM Benchmarking Inc. for the Ministry of Finance, which compares the fund’s management costs with those of other large investment funds, shows that the fund has had the lowest costs in the peer group for many years, measured as a share of assets under management. Management costs have been between 11 and 19 basis points lower than the peer group since 2012. This comparison takes account of differences in fund size and the composition of different asset classes. The CEM report is considered the best source of information on cost levels at comparable funds.
Management costs
Management costs comprise all costs relating to the management of the fund. These are mainly incurred by Norges Bank, but management costs are also incurred by subsidiaries of Norges Bank that are established as part of the management of the fund’s investments in unlisted real estate and unlisted renewable energy infrastructure – see note 12, table 6.4 and table 7.4 in the financial statements for more information related to costs in Norges Bank and subsidiaries.
Total management costs in Norges Bank were 6.6 billion kroner in 2023, up from 5.2 billion kroner in 2022. The increase was mainly due to higher fees to external managers, higher personnel costs following a strengthening of the organisation, currency effects and somewhat higher costs for IT systems and data. Performance-based fees to external managers increased compared to 2022, due to strong excess returns from external management and a larger share of the fund being managed externally. Base fees to external managers also increased, due to a larger share of the fund being managed externally in 2023.
Each year, the Ministry of Finance sets an upper limit for the reimbursement of management costs. Norges Bank is only reimbursed for costs incurred up to this limit. Management costs in subsidiaries are measured against the upper limit but are not reimbursed, as they are expensed directly in the portfolio result. Norges Bank is also reimbursed for performance-based fees to external managers, which are not included in the limit. Total management costs incurred by Norges Bank and subsidiaries, excluding performance-based fees to external managers, were limited to 6.2 billion kroner for 2023. Total management costs measured against the upper limit amounted to 5.4 billion kroner in 2023. These comprised management costs in Norges Bank, excluding performance-based fees to external managers, of 5.3 billion kroner and management costs in subsidiaries of 0.1 billion kroner. This corresponds to 0.037 percent of assets under management, down from 0.039 percent in 2022.

Fixed and variable fees to external managers accounted for 38 percent of management costs in 2023. External managers are used in segments and markets where we believe they will enhance returns. Our strategy is to use external managers primarily for equity investments in emerging markets and for investments in small- and mid-cap companies. The use of external managers has played an important role in achieving the fund’s objective of highest possible return after costs with moderate risk. Up to and including 2023, the cumulative excess return after costs for the external equity mandates was 85 billion kroner.
A share of the fees to external managers varies with the excess return achieved in relation to a benchmark index. Agreements with external managers for performance-based fees are structured so that the bulk of the positive excess return is retained by the fund, and the agreements include caps on the fees that can be paid. Performance-based fees to external managers are therefore expected to be more than offset by excess returns for the fund and will increase when excess returns increase.
The fund’s investments in equities and bonds must be registered with local securities depositories around the world. We use a global custodian institution to assist us with this process. Custody costs as a share of assets under management have fallen in recent years and accounted for 7 percent of management costs in 2023.
The fund’s reporting currency is Norwegian kroner. Exchange rate fluctuations can have a significant accounting impact even if actual costs in foreign currency are unchanged. Over 75 percent of costs are invoiced and paid in foreign currency. This means, for example, that a 25 percent change in the krone exchange rate against other currencies will increase or decrease management costs by around 1,500 million kroner. The weakening of the Norwegian krone against other currencies in recent years has resulted in a substantial increase in costs measured in kroner.
CHART 28 Management costs as a share of assets under management in basis points.
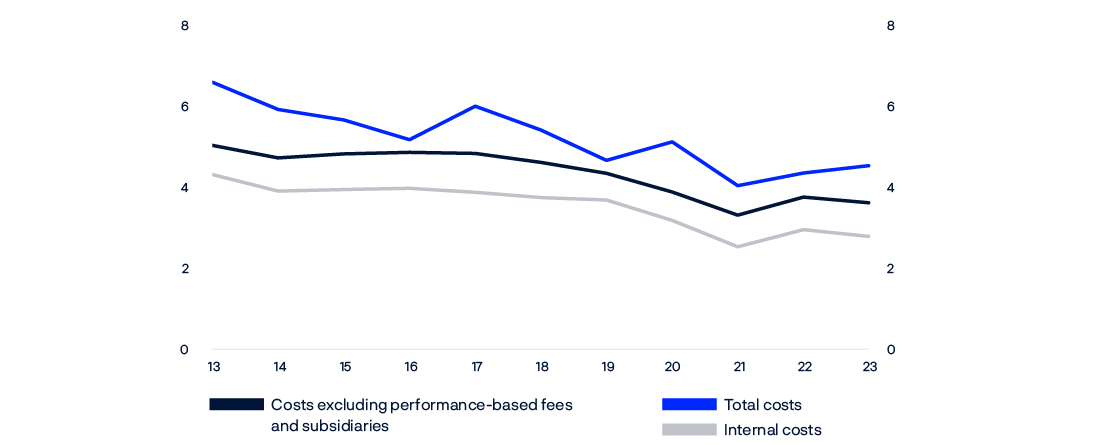
CHART 29 Development of individual cost components. Costs1 (millions of kroner, left-hand axis) and average market value (billions of kroner, right-hand-axis).
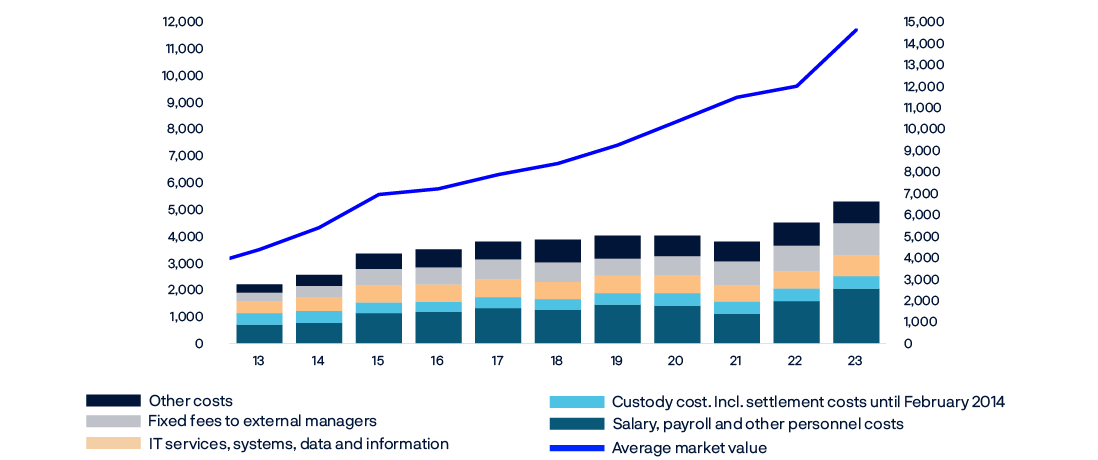
1Excluding performance-based fees and subsidiaries.
Management costs broken down by investment strategy
We pursue a variety of investment strategies in our management of the fund. These strategies complement and influence one another, and there are cost synergies between the strategies. We allocate costs to the different strategies in line with actual costs or using allocation keys based on factors such as number of employees or transaction volumes.
TABLE 32Management costs in basis points per investment strategy in 2023. Costs as reimbursed by the Ministry of Finance.
|
2023 |
Contribution to the fund's management costs |
Management costs based on assets under management |
|---|---|---|
|
Market exposure |
1.6 |
2.2 |
|
Securities selection |
2.6 |
12.0 |
|
Internal security selection |
0.8 |
4.5 |
|
External security selection1 |
1.8 |
38.9 |
|
Fund allocation |
0.3 |
|
|
of which unlisted real estate |
0.2 |
8.2 |
|
Total |
4.5 |
1Includes all externally managed capital.
TABLE 33Management cost in basis points per investment strategy 2013-2023. Costs as reimbursed by the Ministry of Finance.
|
2013–2023 |
Contribution to the fund's management costs |
Management costs based on assets under management |
|---|---|---|
|
Market exposure |
2.1 |
2.7 |
|
Security selection |
2.5 |
14.4 |
|
Internal security selection |
0.7 |
5.3 |
|
External security selection1 |
1.8 |
42.4 |
|
Fund allocation |
0.3 |
|
|
Unlisted real estate2 |
0.4 |
17.9 |
|
Total |
5.2 |
1 Includes all externally managed capital.
2Unlisted real estate is part of the Fund allocation strategy from 2017, but is presented on a separate line for 2013–2023.
Transaction costs
Transaction costs are defined as all costs associated with transactions that directly impact the portfolio result. Both direct and indirect transaction costs are incurred. For equities and bonds, direct transaction costs normally consist of commission fees and transaction taxes, including stamp duty. For unlisted real estate and unlisted renewable energy infrastructure, they include one-off costs for the purchase and sale of investments, including stamp duty, registration fees, due diligence costs and insurance.
We work continuously to keep direct transaction costs low. We do this by taking these costs into account in our investment strategies and minimising the number of transactions. There may therefore be less activity in markets with high commissions or taxes than in markets with lower fixed transaction costs. We also choose counterparties that can execute our investment decisions most cost-effectively. Direct transaction costs amounted to 4.5 billion kroner in 2023, compared to 4.0 billion kroner in 2022. This includes 4.2 billion kroner related to equity investments, 0.2 billion kroner related to investments in unlisted real estate and 0.1 billion kroner related to investments in unlisted renewable energy infrastructure.
In addition to the direct costs described above, indirect costs are incurred when we invest, due to fluctuations in prices from the time we initiate the trade until it is implemented in the market. These costs are included in the portfolio result. Indirect costs for internal equity investments are estimated to be approximately 16 billion kroner in 2023. The corresponding figure for 2022 was 16 billion kroner.1
1Comparative amounts are based on the same methodology as used in 2023.

Income statement
|
Amounts in NOK million |
Note |
2023 |
2022 |
|---|---|---|---|
|
Profit/loss on the portfolio before foreign exchange gain/loss |
|||
|
Income/expense from: |
|||
|
- Equities |
4 |
2 030 561 |
-1 201 835 |
|
- Bonds |
4 |
231 769 |
-453 128 |
|
- Unlisted real estate |
6 |
-47 389 |
-2 213 |
|
- Unlisted infrastructure |
7 |
-257 |
897 |
|
- Financial derivatives |
4 |
15 752 |
23 926 |
|
- Secured lending |
13 |
9 922 |
4 845 |
|
- Secured borrowing |
13 |
-13 278 |
-4 792 |
|
Tax expense |
10 |
-13 555 |
-4 850 |
|
Interest income/expense |
49 |
-22 |
|
|
Other income/expense |
4 |
-4 |
|
|
Profit/loss on the portfolio before foreign exchange gain/loss |
2 213 577 |
-1 637 176 |
|
|
Foreign exchange gain/loss |
11 |
409 441 |
641 850 |
|
Profit/loss on the portfolio |
2 623 018 |
-995 326 |
|
|
Management fee |
12 |
-6 632 |
-5 226 |
|
Profit/loss and total comprehensive income |
2 616 385 |
-1 000 551 |
Balance sheet
|
Amounts in NOK million |
Note |
31.12.2023 |
31.12.2022 |
|---|---|---|---|
|
Assets |
|||
|
Deposits in banks |
8 584 |
12 061 |
|
|
Secured lending |
13,14 |
728 559 |
462 982 |
|
Cash collateral posted |
14 |
19 361 |
21 601 |
|
Unsettled trades |
33 812 |
11 428 |
|
|
Equities |
5 |
10 577 325 |
8 138 602 |
|
Equities lent |
5,13 |
493 949 |
451 799 |
|
Bonds |
5 |
3 563 613 |
2 968 272 |
|
Bonds lent |
5,13 |
1 006 711 |
886 555 |
|
Financial derivatives |
5,14 |
19 192 |
20 498 |
|
Unlisted real estate |
6 |
300 541 |
329 732 |
|
Unlisted infrastructure |
7 |
17 593 |
14 489 |
|
Withholding tax receivable |
10 |
10 522 |
8 937 |
|
Other assets |
17 |
2 752 |
2 017 |
|
Management fee receivable |
168 |
274 |
|
|
Total assets |
16 782 681 |
13 329 248 |
|
|
Liabilities and owner's capital |
|||
|
Secured borrowing |
13,14 |
911 548 |
796 082 |
|
Cash collateral received |
14 |
28 754 |
14 801 |
|
Unsettled trades |
44 247 |
44 329 |
|
|
Financial derivatives |
5,14 |
33 055 |
40 159 |
|
Deferred tax |
10 |
8 246 |
4 488 |
|
Other liabilities |
17 |
112 |
56 |
|
Total liabilities |
1 025 962 |
899 915 |
|
|
Owner's capital |
15 756 719 |
12 429 334 |
|
|
Total liabilities and owner's capital |
16 782 681 |
13 329 248 |
Statement of cash flows
Accounting policy
The statement of cash flows is prepared in accordance with the direct method. Major classes of gross cash receipts and payments are presented separately, with the exception of specific transactions that are presented on a net basis, primarily relating to the purchase and sale of financial instruments. Cash flows related to the fund’s investment activities are presented as operating activities, since they represent the income-generating activities of the fund. Inflows and withdrawals between the GPFG and the Norwegian government are financing activities. These transfers have been settled in the period. Accrued inflows/withdrawals are shown in the statement of changes in owner’s capital.
|
Amounts in NOK million, receipt (+) / payment (-) |
Note |
2023 |
2022 |
|---|---|---|---|
|
Operating activities |
|||
|
Receipts of dividend from equities |
234 173 |
190 235 |
|
|
Receipts of interest from bonds |
90 644 |
55 724 |
|
|
Receipts of interest and dividend from unlisted real estate |
6 |
6 861 |
6 156 |
|
Receipts of interest and dividend from unlisted infrastructure |
7 |
752 |
162 |
|
Net receipts of interest and fee from secured lending and borrowing |
-3 730 |
1 521 |
|
|
Receipts of dividend, interest and fee from holdings of equities, bonds, unlisted real estate and unlisted infrastructure |
328 700 |
253 797 |
|
|
Net cash flow from purchase and sale of equities |
-436 867 |
-719 766 |
|
|
Net cash flow from purchase and sale of bonds |
-412 160 |
-702 877 |
|
|
Net cash flow to/from investments in unlisted real estate |
6 |
-6 742 |
-3 930 |
|
Net cash flow to/from investments in unlisted infrastructure |
7 |
-3 256 |
1 143 |
|
Net cash flow financial derivatives |
2 219 |
52 485 |
|
|
Net cash flow cash collateral related to derivative transactions |
16 030 |
-16 013 |
|
|
Net cash flow secured lending and borrowing |
-184 578 |
52 860 |
|
|
Net payment of taxes |
10 |
-11 173 |
-11 058 |
|
Net cash flow related to interest on deposits in banks and bank overdraft |
428 |
30 |
|
|
Net cash flow related to other income/expense, other assets and other liabilities |
947 |
478 |
|
|
Management fee paid to Norges Bank1 |
-6 526 |
-4 964 |
|
|
Net cash inflow/outflow from operating activities |
-712 977 |
-1 097 816 |
|
|
Financing activities |
|||
|
Inflow from the Norwegian government |
710 104 |
1 089 712 |
|
|
Withdrawal by the Norwegian government |
- |
- |
|
|
Net cash inflow/outflow from financing activities |
710 104 |
1 089 712 |
|
|
Net change deposits in banks |
|||
|
Deposits in banks at 1 January |
12 061 |
18 450 |
|
|
Net increase/decrease of cash in the period |
-2 873 |
-8 104 |
|
|
Net foreign exchange gain/loss on cash |
-604 |
1 715 |
|
|
Deposits in banks at end of period |
8 584 |
12 061 |
1 Management fee in the statement of cash flows consists of transfers to/from the krone account in connection with the settlement of management costs incurred in Norges Bank.
Statement of changes in owner’s capital
Accounting policy
Owner’s capital for the GPFG comprises contributed capital in the form of accumulated net inflows from the Norwegian government and retained earnings in the form of total comprehensive income. Owner’s capital corresponds to the Ministry of Finance’s krone account in Norges Bank.
|
Amounts in NOK million |
Inflows from owner |
Retained earnings |
Total owner's capital |
|---|---|---|---|
|
1 January 2022 |
2 967 570 |
9 372 515 |
12 340 085 |
|
Profit/loss and total comprehensive income |
- |
-1 000 551 |
-1 000 551 |
|
Inflow during the period |
1 089 800 |
- |
1 089 800 |
|
Withdrawal during the period |
- |
- |
- |
|
31 December 2022 |
4 057 370 |
8 371 964 |
12 429 334 |
|
1 January 2023 |
4 057 370 |
8 371 964 |
12 429 334 |
|
Profit/loss and total comprehensive income |
- |
2 616 385 |
2 616 385 |
|
Inflow during the period |
711 000 |
- |
711 000 |
|
Withdrawal during the period |
- |
- |
- |
|
31 December 2023 |
4 768 370 |
10 988 349 |
15 756 719 |
Note 1 General information
1. Introduction
Norges Bank is Norway’s central bank. Norges bank is a separate legal entity and is owned by the state. Norges bank manages the Government Pension Fund Global (GPFG) on behalf of the Ministry of Finance, in accordance with section 3, second paragraph of the Government Pension Fund Act and the management mandate for the GPFG, issued by the Ministry of Finance.
The GPFG shall support government saving to finance future expenditure and underpin long-term considerations relating to the use of Norway’s petroleum revenues. The Storting (Norwegian Parliament) has established the legal framework in the Government Pension Fund Act, and the Ministry of Finance has formal responsibility for the fund’s management. The Executive Board of Norges Bank has delegated day-to-day management of the GPFG to Norges Bank Investment Management (NBIM).
The Ministry of Finance has placed funds for investment in the GPFG in the form of a Norwegian krone deposit with Norges Bank (the krone account). Norges Bank manages the krone account in its own name by investing the funds in an investment portfolio consisting of equities, bonds, real estate and renewable energy infrastructure. The GPFG is invested in its entirety outside of Norway.
Transfers are made to and from the krone account in accordance with the management mandate. When the Norwegian State’s petroleum revenue exceeds the use of petroleum revenue in the fiscal budget, deposits will be made into the krone account. In the opposite situation, withdrawals will be made. Transfers to and from the krone account lead to a corresponding change in Owner’s capital.
For further information on the management mandate for the GPFG, Norges Bank’s governance structure and risk management, see note 9 Investment risk.
2. Approval of the financial statements
The annual financial reporting for the GPFG is an excerpt from Norges Bank’s financial reporting and is included in Norges Bank’s annual financial statements as note 20. The annual financial statements of Norges Bank for 2023 were approved by the Executive Board on 8 February 2024 and approved by the Supervisory Council on 22 February 2024.
Note 2 Accounting policies
This note describes accounting policies, significant estimates and accounting judgements that are relevant to the financial statements as a whole. Additional accounting policies, significant estimates and accounting judgements are included in the respective statements and notes.
Significant estimates and accounting judgements
The preparation of the financial statements involves the use of uncertain estimates and assumptions relating to future events that affect the reported amounts for assets, liabilities, income and expenses. Estimates are based on historical experience and reflect management’s expectations about future events. Actual outcomes may deviate from estimates. The preparation of the financial statements also involves the use of judgement when applying accounting policies, which may have a significant impact on the financial statements.
In cases where there are particularly uncertain estimates or accounting judgements, this is described in the respective notes.
1. Basis of preparation
In accordance with the Regulation on the financial reporting of Norges Bank (the Regulation), laid down by the Ministry of Finance, the financial reporting for the GPFG is prepared in accordance with IFRS Accounting Standards as adopted by the EU, based on the going concern assumption. The annual financial statements are prepared with a closing date of 31 December, and are presented in Norwegian kroner (NOK), rounded to the nearest million. Rounding differences may occur.
2. Changes in accounting policies, including new and amended standards and interpretations in the period
Accounting policies are applied consistently with those of the previous financial year. There are no new or amended IFRS standards and interpretations that have become effective for the financial year starting 1 January 2023, that have had a material impact on the financial statements.
3. New and amended standards and interpretations effective from 2024 or later
Issued IFRS standards, changes in existing standards and interpretations with effective dates from 2024 or later, are expected to be immaterial or not applicable for the financial reporting for the GPFG at the time of implementation.
4. Accounting policies for the financial statements as a whole
4.1 Financial assets and liabilities
Recognition and derecognition
Financial assets and liabilities are recognised in the balance sheet upon becoming a party to the instrument’s contractual provisions.
Financial assets are derecognised when the contractual rights to the cash flows expire, or when the financial assets and substantially all the risks and rewards of ownership are transferred. See note 13 Secured lending and borrowing for details of transferred assets that are not derecognised.
Financial liabilities are derecognised when the obligation is extinguished, i.e. when the obligation specified in the contract is discharged, cancelled or expires.
Purchase or sale of a financial asset where the contractual terms require settlement in accordance with normal market conditions, is recognised on the trade date.
Classification and measurement
Financial assets are classified based on the business model used for managing the assets and their contractual cash flow characteristics. The investment portfolio of the GPFG is managed in accordance with the management mandate issued by the Ministry of Finance, the investment mandate issued by the Executive Board of Norges Bank and investment strategies issued by the management of Norges Bank Investment Management. These mandates and strategies, including the risk management strategies, entail that financial assets are managed and evaluated on a fair value basis. The GPFG’s financial assets are therefore measured at fair value through profit or loss, except for Management fee receivable which is not part of the investment portfolio. Management fee receivable is measured at amortised cost.
Financial liabilities, except for Management fee payable and Deferred tax, are integrated in the investment portfolio which is managed and evaluated on a fair value basis. These are therefore designated at fair value through profit or loss. Management fee payable is measured at amortised cost. See note 10 Tax for information on recognition and measurement of deferred tax.
Financial derivatives are measured at fair value through profit or loss.
4.2 Subsidiaries
Investments in real estate and renewable energy infrastructure are made through subsidiaries of Norges Bank, which are exclusively established as part of the management of the fund. Subsidiaries are controlled by the GPFG and are included in the financial reporting for the GPFG in accordance with section 3-4 of the Regulation. For further information, see note 16 Interests in other entities.
The GPFG is an investment entity in accordance with IFRS 10 Consolidated financial statements. IFRS 10 defines an investment entity and introduces a mandatory exemption from consolidation for investment entities.
Subsidiaries measured at fair value through profit or loss
Subsidiaries that invest in real estate or renewable energy infrastructure through ownership interests in other entities, are investment entities. These subsidiaries are measured at fair value through profit or loss in accordance with the principles for financial assets, as described in section 4.1 above. Subsidiaries that invest in real estate and renewable energy infrastructure are presented in the balance sheet as Unlisted real estate and Unlisted infrastructure, respectively. See note 6 Unlisted real estate and note 7 Unlisted renewable energy infrastructure for supplementary policies.
Consolidated subsidiaries
Subsidiaries that perform investment-related services, and which are not investment entities themselves, are consolidated. Consolidated subsidiaries do not own, neither directly nor indirectly, investments in real estate or infrastructure for renewable energy.
Accounting judgement
The GPFG is an investment entity based on the following:
a) The GPFG receives funds from the Norwegian government, a related party and its sole owner, and delivers professional investment services in the form of management of the fund, to the Norwegian government,
b) The GPFG commits to the Norwegian government that it will invest solely for capital appreciation and investment income,
c) The GPFG measures and evaluates returns for all investments exclusively on a fair value basis.
The GPFG does not have an explicit strategy that defines a specified timeframe for the realisation of each individual investment, but the investments are assessed continuously and purchase and sale assessments are made. Following an overall assessment, it has been concluded that the GPFG meets the criteria in the definition of an investment entity.
Note 3 Returns
Table 3.1 shows return for the fund and for each asset class.
Table 3.1 Returns
|
2023 |
2022 |
|
|---|---|---|
|
Returns measured in the fund's currency basket (percent) |
||
|
Return on equity investments |
21.25 |
-15.36 |
|
Return on fixed-income investments |
6.13 |
-12.11 |
|
Return on unlisted real estate investments |
-12.37 |
0.07 |
|
Return on unlisted infrastructure investments |
3.68 |
5.12 |
|
Return on fund |
16.14 |
-14.11 |
|
Relative return on fund (percentage points) |
-0.18 |
0.87 |
|
Returns measured in Norwegian kroner (percent) |
||
|
Return on equity investments |
26.26 |
-9.27 |
|
Return on fixed-income investments |
10.51 |
-5.78 |
|
Return on unlisted real estate investments |
-8.75 |
7.27 |
|
Return on unlisted infrastructure investments |
7.96 |
12.69 |
|
Return on fund |
20.93 |
-7.93 |
A time-weighted rate of return methodology is applied. The fair value of holdings is determined at the time of cash flows into and out of the asset classes and the fund as a whole. Geometric linking of periodic returns is used for longer return periods.
Returns are calculated net of transaction costs, non-reclaimable withholding taxes on dividends and interest, and taxes on realised capital gains.
Returns are measured both in Norwegian kroner and in the fund’s currency basket. The currency basket is weighted according to the currency composition of the benchmark index for equities and bonds. Returns measured in the fund’s currency basket are calculated as the geometric difference between the fund’s returns measured in Norwegian kroner and the return of the currency basket.
The fund’s relative return is calculated as the arithmetic difference between the fund’s return and the return of the fund’s benchmark index. The fund’s benchmark index consists of global equity and bond indices determined by the Ministry of Finance and is calculated by weighting the monthly returns of the benchmark indices for each of the two asset classes, using the weight in the actual benchmark at the beginning of the month for the respective asset class.
Note 4 Income/expense from equities, bonds and financial derivatives
Accounting policy
Investments in equities, bonds and financial derivatives are measured at fair value through profit and loss. See note 2 Accounting policies for further information.
Tables 4.1 to 4.3 specify the change in fair value in the period, where the line Income/expense shows the amount recognised in profit or loss for the relevant income statement line. The following principles for presentation apply for the respective income and expenses presented in the tables:
Dividend income is recognised on the ex-dividend date, which is when the right to receive the dividend is established.
Interest income is recognised when the interest is accrued. Interest expense is recognised as incurred. The measurement of interest income and expense is based on contractual terms.
Realised gain/loss mainly represents amounts realised when assets or liabilities are derecognised. Average acquisition cost is assigned upon derecognition. Realised gain/loss includes transaction costs, which are expensed as incurred. Transaction costs are defined as all costs directly attributable to the completed transaction. For investments in equities and bonds, these normally comprise commission fees and stamp duty.
Unrealised gain/loss represents changes in fair value for the related balance sheet item during the period, that are not attributable to the aforementioned categories.
Table 4.1 Specification Income/expense from equities
|
Amounts in NOK million |
2023 |
2022 |
|---|---|---|
|
Dividends |
240 842 |
197 631 |
|
Realised gain/loss |
236 321 |
191 774 |
|
Unrealised gain/loss |
1 553 398 |
-1 591 241 |
|
Income/expense from equities before foreign exchange gain/loss |
2 030 561 |
-1 201 835 |
Table 4.2 Specification Income/expense from bonds
|
Amounts in NOK million |
2023 |
2022 |
|---|---|---|
|
Interest |
109 431 |
66 093 |
|
Realised gain/loss |
-101 065 |
-130 749 |
|
Unrealised gain/loss |
223 402 |
-388 472 |
|
Income/expense from bonds before foreign exchange gain/loss |
231 769 |
-453 128 |
Table 4.3 Specification Income/expense from financial derivatives
|
Amounts in NOK million |
2023 |
2022 |
|---|---|---|
|
Interest |
4 185 |
7 449 |
|
Realised gain/loss |
13 404 |
12 616 |
|
Unrealised gain/loss |
-1 837 |
3 862 |
|
Income/expense from financial derivatives before foreign exchange gain/loss |
15 752 |
23 926 |
Note 5 Holdings of equities, bonds and financial derivatives
Accounting policy
Investments in equities and bonds are measured at fair value through profit or loss. Earned dividends and interest are presented in the balance sheet on the same line as the underlying financial instruments. The balance sheet line Equities includes investments in depository certificates (GDR/ADR) and units in listed funds, such as REITs. Lent equities and bonds are presented separately. For more information on lent securities, see note 13 Secured lending and borrowing.
Financial derivatives are measured at fair value through profit or loss. Exchange-traded futures and associated variation margin are presented net in the balance sheet, since there is a legally enforceable right to offset and the intention is to settle on a net basis or to realise the asset and settle the liability simultaneously. Norges Bank does not engage in hedge accounting, therefore no financial instruments are designated as hedging instruments.
For further information on fair value measurement, see note 8 Fair value measurement. Changes in fair value are recognised in the income statement and specified in note 4 Income/expense from equities, bonds and financial derivatives.
Table 5.1 specifies the sector composition of investments in equities.
Table 5.1 Equities
|
31.12.2023 |
31.12.2022 |
|
|---|---|---|
|
Amounts in NOK million |
Fair value incl. earned dividends |
Fair value incl. earned dividends |
|
Technology |
2 465 516 |
1 517 241 |
|
Financials |
1 655 254 |
1 370 888 |
|
Consumer discretionary |
1 562 073 |
1 151 176 |
|
Industrials |
1 447 684 |
1 141 525 |
|
Health care |
1 230 877 |
1 104 937 |
|
Consumer staples |
618 337 |
569 295 |
|
Real estate |
608 689 |
478 101 |
|
Basic materials |
441 742 |
381 322 |
|
Energy |
413 062 |
378 240 |
|
Telecommunications |
367 904 |
265 277 |
|
Utilities |
260 137 |
232 400 |
|
Total equities |
11 071 274 |
8 590 402 |
|
Of which presented in the balance sheet line Equities |
10 577 325 |
8 138 602 |
|
Of which presented in the balance sheet line Equities lent |
493 949 |
451 799 |
At the end of 2023, earned dividends amounted to NOK 12 580 million (NOK 10 306 million in 2022).
Table 5.2 specifies investments in bonds per category. Notional value represents the amount that shall be returned at maturity, also referred to as the par value of the bond.
Table 5.2 Bonds
|
31.12.2023 |
31.12.2022 |
|||
|---|---|---|---|---|
|
Amounts in NOK million |
Notional value |
Fair value incl. earned interest |
Notional value |
Fair value incl. earned interest |
|
Government bonds |
||||
|
Government bonds issued in the government's local currency |
2 742 815 |
2 594 816 |
2 366 163 |
2 165 605 |
|
Total government bonds |
2 742 815 |
2 594 816 |
2 366 163 |
2 165 605 |
|
Government-related bonds |
||||
|
Sovereign bonds |
11 311 |
10 632 |
11 053 |
9 460 |
|
Bonds issued by local authorities |
154 963 |
142 393 |
149 232 |
132 412 |
|
Bonds issued by supranational bodies |
101 177 |
98 290 |
104 967 |
90 526 |
|
Bonds issued by federal agencies |
166 493 |
155 662 |
162 295 |
149 450 |
|
Total government-related bonds |
433 944 |
406 977 |
427 547 |
381 848 |
|
Inflation-linked bonds |
||||
|
Inflation-linked bonds issued by government authorities |
232 929 |
283 137 |
250 560 |
243 441 |
|
Total inflation-linked bonds |
232 929 |
283 137 |
250 560 |
243 441 |
|
Corporate bonds |
||||
|
Convertible bonds |
57 |
73 |
- |
- |
|
Bonds issued by utilities |
100 984 |
95 387 |
83 977 |
74 812 |
|
Bonds issued by financial institutions |
466 844 |
446 681 |
427 297 |
382 224 |
|
Bonds issued by industrial companies |
487 613 |
460 147 |
419 297 |
372 278 |
|
Total corporate bonds |
1 055 498 |
1 002 288 |
930 570 |
829 314 |
|
Securitised bonds |
||||
|
Covered bonds |
307 782 |
283 106 |
269 778 |
234 618 |
|
Total securitised bonds |
307 782 |
283 106 |
269 778 |
234 618 |
|
Total bonds |
4 772 968 |
4 570 324 |
4 244 619 |
3 854 827 |
|
Of which presented in the balance sheet line Bonds |
3 563 613 |
2 968 272 |
||
|
Of which presented in the balance sheet line Bonds lent |
1 006 711 |
886 555 |
||
At the end of 2023, earned interest amounted to NOK 34 537 million (NOK 22 218 million in 2022).
Financial derivatives
Financial derivatives are used to adjust the exposure in various portfolios as a cost-efficient alternative to trading in the underlying securities. Foreign exchange derivatives are also used in connection with liquidity management. Equity derivatives with an option component are often a result of corporate actions, and can be converted into equities or sold. The GPFG also uses equity swaps in combination with purchase and sale of equities.
Table 5.3 specifies financial derivatives recognised in the balance sheet. Notional amounts are the basis for calculating any cash flows and gains/losses for derivative contracts. This provides information on the extent to which different types of financial derivatives are used.
Table 5.3 Financial derivatives
|
31.12.2023 |
31.12.2022 |
|||||
|---|---|---|---|---|---|---|
|
Amounts in NOK million |
Notional amount |
Fair value |
Notional amount |
Fair value |
||
|
Asset |
Liability |
|||||
|
Asset |
Liability |
|||||
|
Foreign exchange derivatives |
976 868 |
6 388 |
18 148 |
1 028 213 |
6 955 |
28 135 |
|
Interest rate derivatives |
464 466 |
11 920 |
12 323 |
390 528 |
13 049 |
11 615 |
|
Credit derivatives |
52 311 |
706 |
2 556 |
53 290 |
- |
375 |
|
Equity derivatives1 |
- |
69 |
- |
- |
274 |
- |
|
Exchange-traded futures contracts2 |
95 742 |
110 |
29 |
91 638 |
221 |
34 |
|
Total financial derivatives |
1 589 387 |
19 192 |
33 055 |
1 563 669 |
20 498 |
40 159 |
1 Notional amounts are not considered relevant for equity derivatives and are therefore not included in the table.
2 Exchange-traded futures contracts have daily margin payments and the net amount recognised in the balance sheet is normally zero at the balance sheet date, with the exception of futures contracts in certain markets where there is different timing for setting the market value for recognition in the balance sheet and daily margining.
Foreign exchange derivatives
This consists of foreign exchange forward contracts, which are agreements to buy or sell a specified quantity of foreign currency on an agreed future date.
Interest rate derivatives
This consists of agreements between two parties to exchange interest payment streams based on different interest rate calculation methods. Interest rate derivatives recognised in the balance sheet are mainly interest rate swaps, where one party pays a floating rate of interest and the other pays a fixed rate.
Credit derivatives
This comprises credit default swaps indices (CDS indices) for corporate bonds, where one party (the seller) assumes the credit risk and the other party (the buyer) reduces the credit risk on the underlying index of corporate bonds. Under a CDS index contract, the seller receives a periodic coupon from the buyer as compensation for assuming the credit risk. The buyer only receives payment if the credit protection is triggered by for instance default on the underlying credit in the index (credit event).
Equity derivatives
Equity derivatives are derivatives with exposure to an underlying equity. Equity derivatives recognised in the balance sheet include instruments with an option component, such as rights and warrants. These instruments grant the owner the right to purchase an equity at an agreed price within a certain time frame.
Futures contracts
Futures contracts are listed contracts to buy or sell a specified asset (security, index, interest rate, power or similar assets) at an agreed price at a future point in time.
Equity swaps in combination with purchase or sale of equities
Equity swaps are entered into in combination with purchases or sales of equities, as part of the fund’s secured lending and borrowing activities. See note 13 Secured lending and borrowing for further information. The GPFG does not take market risk in these transactions and therefore has virtually no net exposure. The equity swaps (derivative) are not recognised in the balance sheet. At the end of 2023, equities purchased in combination with offsetting equity swaps amounted to NOK 250 billion (NOK 104 billion at the end of 2022). Equity sales in combination with offsetting equity swaps amounted to NOK 132 billion (NOK 105 billion at the end of 2022). See also table 14.1 in note 14 Collateral and offsetting.
Note 6 Unlisted real estate
Accounting policy
Investments in unlisted real estate are made through subsidiaries of Norges Bank, exclusively established as part of the management of the GPFG. Subsidiaries presented as Unlisted real estate in the balance sheet are measured at fair value through profit or loss. See note 2 Accounting policies for further information.
The fair value of unlisted real estate is equivalent to the sum of the GPFG’s share of assets and liabilities in the underlying real estate subsidiaries, measured at fair value. For further information, see note 8 Fair value measurement.
Changes in fair value are recognised in the income statement and presented as Income/expense from unlisted real estate.
The following principles for presentation apply for the respective income and expense elements presented in table 6.1:
Interest is recognised when it is earned.
Dividends are recognised when the dividend is formally approved by the general meeting or equivalent decision-making body, or is paid out in accordance with the company’s articles of association.
Table 6.1 Income/expense from unlisted real estate
|
Amounts in NOK million |
2023 |
2022 |
|---|---|---|
|
Receipts of interest and dividend |
6 861 |
6 156 |
|
Unrealised gain/loss1 |
-54 251 |
-8 369 |
|
Income/expense from unlisted real estate before foreign exchange gain/loss |
-47 389 |
-2 213 |
1 Earned interest and dividends which are not cash-settled are included in Unrealised gain/loss.
Table 6.2 Changes in carrying amounts unlisted real estate
|
Amounts in NOK million |
31.12.2023 |
31.12.2022 |
|---|---|---|
|
Unlisted real estate at 1 January |
329 732 |
310 134 |
|
Net cash flow to/from investments |
6 742 |
3 930 |
|
Unrealised gain/loss |
-54 251 |
-8 369 |
|
Foreign exchange gain/loss |
18 318 |
24 036 |
|
Unlisted real estate, closing balance for the period |
300 541 |
329 732 |
Cash flows between the GPFG and subsidiaries presented as Unlisted real estate
The GPFG makes cash contributions to subsidiaries in the form of equity and long-term loan financing, to fund investments in real estate assets, primarily properties. Net income in the underlying real estate companies can be distributed back to the GPFG in the form of interest and dividend as well as repayment of equity and loan financing. There are no significant restrictions on the distribution of interest and dividend from subsidiaries to the GPFG.
Net income distributed back to the GPFG in the form of interest and dividend is presented in the statement of cash flows as Receipts of interest and dividend from unlisted real estate. Cash flows in the form of equity and loan financing, as well as repayment of these, are presented in the statement of cash flows as Net cash flows to/from investments in unlisted real estate.
Net income that is not distributed back to the GPFG is reinvested in the underlying real estate companies, to finance for instance property development and repayment of external debt.
A net cash flow from the GPFG to subsidiaries will result in an increase in the value of Unlisted real estate in the balance sheet, while a net cash flow from subsidiaries to the GPFG will result in a decrease.
Tables 6.3 specifies cash flows between the GPFG and subsidiaries presented as Unlisted real estate.
Table 6.3 Cash flow unlisted real estate
|
Amounts in NOK million |
2023 |
2022 |
|---|---|---|
|
Receipts of interest from ongoing operations |
2 042 |
1 568 |
|
Receipts of dividends from ongoing operations |
4 709 |
4 200 |
|
Receipts of interest from sales |
110 |
219 |
|
Receipts of dividends from sales |
- |
168 |
|
Receipts of interest and dividend from unlisted real estate |
6 861 |
6 156 |
|
Payments for new investments |
-7 007 |
-7 074 |
|
Payments for property development |
-1 778 |
-1 186 |
|
Net payments external debt |
-104 |
72 |
|
Receipts from ongoing operations |
1 533 |
1 694 |
|
Receipts from sales |
615 |
2 564 |
|
Net cash flow to/from investments in unlisted real estate |
-6 742 |
-3 930 |
|
Net cash flow unlisted real estate |
119 |
2 225 |
|
Of which cash flow from ongoing operations |
8 284 |
7 463 |
|
Of which cash flow to/from other activities |
-8 164 |
-5 237 |
Underlying real estate companies
Real estate subsidiaries have investments in other non-consolidated, unlisted companies. For further information, see note 16 Interests in other entities.
Principles for presentation
The following principles apply for the respective income and expense elements in the subsidiaries presented in table 6.4:
Rental income is recognised on a straight-line basis over the lease term. Net rental income mainly comprises accrued rental income, less costs relating to the operation and maintenance of properties.
Asset management fees are directly related to the underlying properties and are primarily linked to the operation and development of properties and leases. Fixed fees are expensed as incurred. Variable fees to external asset managers are based on achieved performance over time. The provision for variable fees is based on the best estimate of the incurred fees to be paid. The change in best estimate in the period is recognised in profit or loss.
Transaction costs and fees from purchases and sales of properties are incurred as one-off costs and expensed as incurred.
Table 6.4 specifies the GPFG’s share of net income generated in the underlying real estate companies, which is the basis for Income/expense from unlisted real estate presented in table 6.1.
Table 6.4 Income from underlying real estate companies
|
Amounts in NOK million |
2023 |
2022 |
|---|---|---|
|
Net rental income |
13 852 |
12 807 |
|
External asset management - fixed fees |
-1 044 |
-1 071 |
|
External asset management - variable fees |
-23 |
-33 |
|
Internal asset management - fixed fees1 |
-123 |
-99 |
|
Operating costs in wholly-owned subsidiaries2 |
-82 |
-65 |
|
Operating costs in joint ventures |
-171 |
-166 |
|
Interest expense external debt |
-776 |
-644 |
|
Tax expense |
-210 |
-303 |
|
Net income from ongoing operations |
11 424 |
10 427 |
|
Realised gain/loss |
46 |
769 |
|
Unrealised gain/loss3 |
-58 630 |
-13 085 |
|
Realised and unrealised gain/loss |
-58 584 |
-12 316 |
|
Transaction costs and fees from purchases and sales |
-229 |
-324 |
|
Net income underlying real estate companies |
-47 389 |
-2 213 |
1 Internal asset management is carried out on 100 percent owned properties by employees in a wholly-owned, consolidated subsidiary.
2 Operating costs in wholly-owned subsidiaries are measured against the upper limit from the Ministry of Finance, see note 12 for more information.
3 Unrealised gain/loss presented in table 6.1 includes net income in the underlying real estate companies which is not distributed back to the GPFG, and will therefore not correspond to Unrealised gains/loss presented in table 6.4.
Table 6.5 specifies the GPFG’s share of assets and liabilities in the underlying real estate companies, which comprises the closing balance for Unlisted real estate as presented in table 6.2.
Table 6.5 Assets and liabilities underlying real estate companies
|
Amounts in NOK million |
31.12.2023 |
31.12.2022 |
|---|---|---|
|
Properties |
327 165 |
356 518 |
|
External debt |
-25 564 |
-24 751 |
|
Net other assets and liabilities1 |
-1 060 |
-2 036 |
|
Total assets and liabilities underlying real estate companies |
300 541 |
329 732 |
1 Net other assets and liabilities comprise cash, tax and operational receivables and liabilities.
Note 7 Unlisted renewable energy infrastructure
Accounting policy
Investments in unlisted renewable energy infrastructure (Unlisted infrastructure) are made through subsidiaries of Norges Bank, exclusively established as part of the management of the GPFG. Subsidiaries presented as Unlisted infrastructure in the balance sheet are measured at fair value through profit or loss. See note 2 Accounting policies for further information.
The fair value of unlisted infrastructure is equivalent to the sum of the GPFG’s share of assets and liabilities in the underlying infrastructure subsidiaries, measured at fair value. For further information, see note 8 Fair value measurement.
Changes in fair value are recognised in the income statement and presented as Income/expense from unlisted infrastructure.
The following principles for presentation apply for the respective income and expense elements presented in table 7.1:
Interest is recognised when it is earned.
Dividends are recognised when the dividend is formally approved by the general meeting or equivalent decision-making body, or is paid out in accordance with the company’s articles of association.
Table 7.1 Income/expense from unlisted infrastructure
|
Amounts in NOK million |
2023 |
2022 |
|---|---|---|
|
Receipts of interest and dividend |
752 |
162 |
|
Unrealised gain/loss1 |
-1 010 |
735 |
|
Income/expense from unlisted infrastructure before foreign exchange gain/loss |
-257 |
897 |
1 Earned interest and dividends which are not cash-settled are included in Unrealised gain/loss.
Table 7.2 Changes in carrying amounts unlisted infrastructure
|
Amounts in NOK million |
31.12.2023 |
31.12.2022 |
|---|---|---|
|
Unlisted infrastructure at 1 January |
14 489 |
14 287 |
|
Net cash flow to/from investments |
3 256 |
-1 143 |
|
Unrealised gain/loss |
-1 010 |
735 |
|
Foreign exchange gain/loss |
859 |
609 |
|
Unlisted infrastructure, closing balance for the period |
17 593 |
14 489 |
Cash flows between the GPFG and subsidiaries presented as Unlisted infrastructure
The GPFG makes cash contributions to subsidiaries in the form of equity and long-term loan financing, to fund investments in renewable energy infrastructure. Net income in the underlying infrastructure companies can be distributed back to the GPFG in the form of interest and dividend as well as repayment of equity and loan financing. There are no significant restrictions on the distribution of interest and dividend from subsidiaries to the GPFG.
Net income which is distributed back to the GPFG in the form of interest and dividend is presented in the statement of cash flows as Receipts of interest and dividend from unlisted infrastructure. Cash flows in the form of equity and loan financing, as well as repayment of these, are presented in the statement of cash flows as Net cash flows to/from investments in unlisted infrastructure.
A net cash flow from the GPFG to subsidiaries will result in an increase in the value of Unlisted infrastructure in the balance sheet, while a net cash flow from subsidiaries to the GPFG will result in a decrease.
Table 7.3 specifies cash flows between the GPFG and subsidiaries presented as Unlisted infrastructure.
Table 7.3 Cash flow unlisted infrastructure
|
Amounts in NOK million |
2023 |
2022 |
|---|---|---|
|
Receipts of interest from ongoing operations |
397 |
162 |
|
Receipts of dividends from ongoing operations |
355 |
- |
|
Receipts of interest and dividend from unlisted infrastructure |
752 |
162 |
|
Payments for new investments |
-2 939 |
- |
|
Payments for development of infrastructure assets |
-1 071 |
- |
|
Receipts from ongoing operations |
755 |
1 143 |
|
Net cash flow to/from investments in unlisted infrastructure |
-3 256 |
1 143 |
|
Net cash flow unlisted infrastructure |
-2 504 |
1 305 |
|
Of which cash flow from ongoing operations |
1 507 |
1 305 |
|
Of which cash flow to/from other activities |
-4 010 |
- |
Underlying infrastructure companies
Infrastructure subsidiaries have investments in other non-consolidated, unlisted companies. For further information, see note 16 Interests in other entities.
Principles for presentation
The following principles apply for the respective income and expense elements in the subsidiaries presented in table 7.4:
Income from the sale of renewable energy is recognised at the time of delivery. Net income from the sale of renewable energy mainly comprises accrued income less costs relating to the operation and maintenance of infrastructure assets.
Transaction costs and fees from purchases and sales of infrastructure for renewable energy are incurred as one-off costs and expensed as incurred.
Table 7.4 specifies the GPFG’s share of net income generated in the underlying infrastructure companies, which is the basis for Income/expense from unlisted infrastructure presented in table 7.1.
Table 7.4 Income from underlying infrastructure companies
|
Amounts in NOK million |
2023 |
2022 |
|---|---|---|
|
Net income from sale of renewable energy |
1 356 |
2 175 |
|
Operating costs in wholly-owned subsidiaries1 |
-8 |
-6 |
|
Operating costs in joint ventures |
-32 |
-16 |
|
Tax expense |
-70 |
-353 |
|
Interest income/expense |
26 |
- |
|
Net income from ongoing operations |
1 273 |
1 799 |
|
Unrealised gain/loss2 |
-1 468 |
-898 |
|
Transaction costs and fees from purchases |
-62 |
-4 |
|
Net income underlying infrastructure companies |
-257 |
897 |
1 Operating costs in wholly-owned subsidiaries are measured against the upper limit from the Ministry of Finance, see note 12 for more information.
2 Unrealised gain/loss presented in table 7.1 includes net income in the underlying infrastructure companies which is not distributed back to the GPFG, and will therefore not correspond to Unrealised gains/loss presented in table 7.4.
Table 7.5 specifies the GPFG’s share of assets and liabilities in the underlying infrastructure companies, which comprises the closing balance for Unlisted infrastructure as presented in table 7.2.
Table 7.5 Assets and liabilities underlying infrastructure companies
|
Amounts in NOK million |
31.12.2023 |
31.12.2022 |
|---|---|---|
|
Infrastructure assets |
15 936 |
13 983 |
|
Net other assets and liabilities1 |
1 657 |
506 |
|
Total assets and liabilities underlying infrastructure companies |
17 593 |
14 489 |
1 Net other assets and liabilities comprise cash, tax and operational receivables and liabilities.
Note 8 Fair value measurement
Accounting policy
All assets and liabilities presented as Equities, Bonds, Unlisted real estate, Unlisted infrastructure, Financial derivatives, Secured lending and borrowing, Deposits in banks and Cash collateral posted and received are measured at fair value through profit or loss.
Fair value, as defined by IFRS 13 Fair value measurement, is the price that would be received to sell an asset or paid to transfer a liability in an orderly transaction between market participants at the measurement date.
1. Introduction
Fair value for the majority of assets and liabilities is based on quoted market prices or observable market inputs. If the market is not active, fair value is established using standard valuation techniques. Estimating fair value can be complex and requires the use of judgement, particularly when observable inputs are not available. This valuation risk is addressed by the control environment in Norges Bank Investment Management, which is described in section 6 of this note.
2. The fair value hierarchy
All assets and liabilities that are part of the investment portfolio are classified in the three categories in the fair value hierarchy presented in table 8.1. The classification is determined by the observability of the market inputs used in the fair value measurement:
- Level 1 comprises assets that are valued based on unadjusted quoted prices in active markets. An active market is defined as a market in which transactions take place with sufficient frequency and volume to provide pricing information on an ongoing basis.
- Assets and liabilities classified as Level 2 are valued using models with market inputs that are either directly or indirectly observable. Inputs are considered observable when they are developed based on market data reflecting actual events and transactions.
- Assets classified as Level 3 are valued using models with significant use of unobservable inputs. Inputs are considered to be unobservable when market data is not available, and the input is developed using the best available information on the assumptions that market participants would use when pricing the asset.
An overview of models and valuation techniques with their respective observable and unobservable inputs, categorised by type of instrument, is provided in section 4 of this note.
Significant estimates
Classification in the fair value hierarchy is based on set criteria, some of which may require the use of judgement.
Level 3 investments consist of instruments measured at fair value that are not traded or quoted in active markets. Fair value is determined using valuation techniques that use models with significant use of unobservable inputs. A considerable degree of judgement is applied in determining the assumptions that market participants would use when pricing the asset or liability, when observable market data is not available.
Table 8.1 Categorisation of the investment portfolio by level in the fair value hierarchy
|
Level 1 |
Level 2 |
Level 3 |
Total |
|||||
|---|---|---|---|---|---|---|---|---|
|
Amounts in NOK million |
31.12.2023 |
31.12.2022 |
31.12.2023 |
31.12.2022 |
31.12.2023 |
31.12.2022 |
31.12.2023 |
31.12.2022 |
|
Equities |
11 033 488 |
8 556 594 |
36 286 |
30 602 |
1 500 |
3 206 |
11 071 274 |
8 590 402 |
|
Government bonds |
2 165 249 |
1 929 618 |
429 567 |
235 987 |
- |
- |
2 594 816 |
2 165 605 |
|
Government-related bonds |
340 242 |
303 108 |
65 926 |
78 406 |
809 |
334 |
406 977 |
381 848 |
|
Inflation-linked bonds |
220 652 |
204 037 |
62 485 |
39 404 |
- |
- |
283 137 |
243 441 |
|
Corporate bonds |
942 658 |
740 645 |
59 628 |
88 663 |
2 |
6 |
1 002 288 |
829 314 |
|
Securitised bonds |
256 012 |
202 781 |
26 989 |
31 837 |
105 |
- |
283 106 |
234 618 |
|
Total bonds |
3 924 813 |
3 380 189 |
644 595 |
474 297 |
916 |
340 |
4 570 324 |
3 854 827 |
|
Financial derivatives (assets) |
282 |
429 |
18 906 |
20 024 |
4 |
45 |
19 192 |
20 498 |
|
Financial derivatives (liabilities) |
-1 633 |
-409 |
-31 422 |
-39 750 |
- |
- |
-33 055 |
-40 159 |
|
Total financial derivatives |
-1 351 |
20 |
-12 516 |
-19 726 |
4 |
45 |
-13 863 |
-19 661 |
|
Unlisted real estate |
- |
- |
- |
- |
300 541 |
329 732 |
300 541 |
329 732 |
|
Unlisted infrastructure |
- |
- |
- |
- |
17 593 |
14 489 |
17 593 |
14 489 |
|
Other (assets)1 |
- |
- |
803 590 |
519 026 |
- |
- |
803 590 |
519 026 |
|
Other (liabilities)2 |
- |
- |
-984 661 |
-859 756 |
- |
- |
-984 661 |
-859 756 |
|
Market value investment portfolio3 |
14 956 950 |
11 936 803 |
487 294 |
144 443 |
320 554 |
347 812 |
15 764 797 |
12 429 059 |
|
Total (percent) |
94.9 |
96.0 |
3.1 |
1.2 |
2.0 |
2.8 |
100.0 |
100.0 |
1 Other (assets) consists of the balance sheet lines Deposits in banks, Secured lending, Cash collateral posted, Unsettled trades (assets), Withholding tax receivable and Other assets.
2 Other (liabilities) consists of the balance sheet lines Secured borrowing, Cash collateral received, Unsettled trades (liabilities) and Other liabilities.
3 Deferred tax is not included as part of the investment portfolio from 2023.
The majority of the total portfolio is priced based on observable market prices. At the end of 2023, 98.0 percent of the portfolio was classified as Level 1 or 2, which is a marginal increase compared to year-end 2022. Movements between levels in the fair value hierarchy are described in section 3 of this note.
Equities
Measured as a share of total value, virtually all equities (99.66 percent) were valued based on official closing prices from stock exchanges at the end of 2023 and classified as Level 1. A small share of equities (0.33 percent) were classified as Level 2 at year-end. These are mainly equities for which trading has recently been suspended, or illiquid securities that are not traded daily. The share of equities valued with significant use of unobservable inputs and classified as Level 3 at year-end was 0.01 percent. These are equities that are not listed, or where trading has been suspended and an adjustment has been applied to the last traded price based on company- or country-specific factors.
Bonds
The majority of bonds have observable, executable market quotes in active markets and 85.88 percent of bond holdings were classified as Level 1 at the end of 2023. Bond holdings that do not have a sufficient number of observable quotes or that are priced based on comparable liquid bonds are classified as Level 2. These amounted to 14.10 percent of bond holdings at year-end. An insignificant share of bond holdings (0.02 percent) that did not have observable quotes were classified as Level 3 at year-end, since the valuation was based on significant use of unobservable inputs.
Unlisted real estate and unlisted renewable energy infrastructure
All investments in unlisted real estate and unlisted renewable energy infrastructure are classified as Level 3, since models are used to value the underlying assets and liabilities with extensive use of unobservable market inputs. Properties and investments in unlisted infrastructure are measured at the value determined by external valuers. Exceptions to this policy are newly acquired properties where the purchase price, excluding transaction costs, is normally considered to be the best estimate of fair value, or where there are indications that the value determined by external valuers does not reflect fair value and adjustments are therefore warranted.
Financial derivatives
Some equity derivatives (rights and warrants) and credit derivatives (CDS indices) that are actively traded are classified as Level 1. The majority of derivatives are classified as Level 2, since the valuation of these is based on standard models using observable market inputs. Certain derivatives are valued based on models with significant use of unobservable inputs and are classified as Level 3.
Other assets and liabilities that are part of the investment portfolio are classified as Level 2.
3. Movements between the levels in the fair value hierarchy
Accounting policy
Transfers between levels in the fair value hierarchy are deemed to have occurred at the beginning of the reporting period.
Reclassifications between Level 1 and Level 2
The share of equities classified as Level 1 was virtually unchanged compared to year-end 2022. There were no significant reclassifications of equities between Level 1 and Level 2.
The share of bonds classified as Level 1 decreased by 1.8 percentage points compared to year-end 2022, with a corresponding increase in the share of Level 2 holdings. The primary drivers of this change were net purchases of government bonds classified as Level 2. There was a net reclassification from Level 2 to Level 1 of NOK 13 billion during the year. This consisted of bonds with a value of NOK 64 billion which were reclassified from Level 2 to Level 1, primarily due to increased price observability for corporate bonds, offset by bonds with a value of NOK 51 billion which were reclassified from Level 1 to Level 2.
Reclassifications between Level 2 and Level 3
The share of equities classified as Level 3 was slightly reduced compared to year-end 2022, due to negative value development for equities in this level. There were no significant reclassifications of equities between Level 2 and Level 3. The share of bonds classified as Level 3 was virtually unchanged compared to year-end 2022. There was a net reclassification of government-related bonds from Level 2 to Level 3 during the year of NOK 466 million.
Table 8.2 Changes in Level 3 holdings
|
Amounts in NOK million |
01.01.2023 |
Purchases |
Sales |
Settlements |
Net gain/loss |
Transferred into Level 3 |
Transferred out of Level 3 |
Foreign exchange gain/loss |
31.12.2023 |
|---|---|---|---|---|---|---|---|---|---|
|
Equities |
3 206 |
- |
-100 |
-21 |
-1 328 |
47 |
-1 |
-303 |
1 500 |
|
Bonds |
340 |
245 |
-147 |
-54 |
45 |
563 |
-97 |
20 |
916 |
|
Financial derivatives (assets) |
45 |
4 |
-45 |
- |
- |
- |
- |
- |
4 |
|
Unlisted real estate1 |
329 732 |
6 742 |
- |
- |
-54 251 |
- |
- |
18 318 |
300 541 |
|
Unlisted infrastructure1 |
14 489 |
3 256 |
- |
- |
-1 010 |
- |
- |
859 |
17 593 |
|
Total |
347 812 |
10 247 |
-292 |
-75 |
-56 544 |
610 |
-98 |
18 894 |
320 554 |
|
Amounts in NOK million |
01.01.2022 |
Purchases |
Sales |
Settlements |
Net gain/loss |
Transferred into Level 3 |
Transferred out of Level 3 |
Foreign exchange gain/loss |
31.12.2022 |
|---|---|---|---|---|---|---|---|---|---|
|
Equities |
1 349 |
83 |
-1 014 |
310 |
-28 634 |
27 678 |
-152 |
3 585 |
3 206 |
|
Bonds |
7 |
237 |
- |
- |
-20 |
103 |
- |
13 |
340 |
|
Financial derivatives (assets) |
- |
- |
- |
- |
-20 |
60 |
- |
5 |
45 |
|
Unlisted real estate1 |
310 134 |
3 930 |
- |
- |
-8 369 |
- |
- |
24 036 |
329 732 |
|
Unlisted infrastructure1 |
14 287 |
-1 143 |
- |
- |
735 |
- |
- |
609 |
14 489 |
|
Total |
325 777 |
3 108 |
-1 014 |
310 |
-36 308 |
27 841 |
-152 |
28 248 |
347 812 |
1 Purchases represent the net cash flow to investments in unlisted real estate and unlisted infrastructure, as presented in the Statement of cash flows.
The share of the portfolio classified as Level 3 was 2.0 percent at the end of 2023, a decrease from 2.8 percent at year-end 2022. The GPFG’s aggregate holdings in Level 3 amounted to NOK 320 554 million at year-end 2023, a decrease of NOK 27 258 million compared to year-end 2022. The decrease is mainly due to investments in unlisted real estate which are all classified as Level 3.
Investments in unlisted real estate amounted to NOK 300 541 million at year-end, a decrease of NOK 29 191 million compared to year-end 2022. The decrease is mainly due to unrealised losses, partly offset by foreign exchange gains and new investments.
4. Valuation techniques
Norges Bank Investment Management has defined hierarchies for which price sources are to be used in the valuation. Holdings that are included in the benchmark indices are normally valued in accordance with prices from the index providers, while the remaining holdings of equities and bonds are valued almost exclusively using prices from other external price providers. For equities and derivatives traded in active markets (Level 1), the close price is used. For bonds traded in active markets, the bid price is generally used. Market activity and volumes are monitored using several price sources that provide access to market prices, quotes and transactions at the measurement date.
The next section sets out the valuation techniques used for instruments classified as Level 2 and Level 3 in the fair value hierarchy. In addition, the most significant observable and unobservable inputs used in the valuation models are described.
Unlisted real estate (Level 3)
The fair value of unlisted real estate is determined as the sum of the underlying assets and liabilities as presented in note 6 Unlisted real estate. Assets and liabilities consist mainly of properties and external debt. Properties are valued at each reporting date by external certified and independent valuation specialists using valuation models. Valuation of properties is inherently dependent on significant forward-looking assumptions. These include key estimates with respect to each individual property type, location, future estimated net cash flows and relevant yields. These assumptions represent primarily unobservable inputs and unlisted real estate is therefore classified as Level 3 in the fair value hierarchy. Assumptions used reflect recent comparable market transactions of properties with a similar location and quality.
Valuation of commercial real estate is based on variations of discounted cash flow models.
Yields and assumptions regarding expected future cash flows are the most important inputs in the valuation models. Expected future cash flows are affected by changes in assumptions related to, but not limited to:
- Estimated market rental values and market rental value growth
- Changes in actual tenancy situation
- Expected inflation (market, consumer price index, costs, etc.)
- Renewal and tenant default probabilities, void periods, operating costs and capital costs
The asset values are estimated by discounting the expected future cash flows. The discount rates used take into account a range of factors reflecting the specific investment, including asset level characteristics, market outlook, comparable market transactions and the local and global economic environment. For certain investments, the capitalisation method, also known as the traditional method, is used in line with local market convention. The traditional method capitalises the current net income with a capitalisation rate that incorporates the same factors as the above-mentioned discount rate and estimated cash flows.
Table 8.3 provides information on the significant unobservable inputs used in the measurement of fair value for investments in unlisted real estate.
Table 8.3 Unobservable inputs – Unlisted real estate
|
Property type |
Fair value in NOK million |
Valuation methodology |
Average equivalent yield/discount rate in percent |
Average annual market rent per square meter (in NOK) |
|||
|---|---|---|---|---|---|---|---|
|
31.12.2023 |
31.12.2022 |
31.12.2023 |
31.12.2022 |
31.12.2023 |
31.12.2022 |
||
|
Office |
|||||||
|
Europe |
28 291 |
81 048 |
Income capitalisation |
4.6 |
3.6 |
11 191 |
7 183 |
|
Europe |
47 864 |
- |
Discounted cash flow |
5.3 |
- |
6 700 |
- |
|
US |
74 128 |
89 789 |
Discounted cash flow |
7.3 |
6.3 |
8 152 |
8 018 |
|
Retail |
|||||||
|
Europe |
13 814 |
35 104 |
Income capitalisation |
5.1 |
3.8 |
17 549 |
16 791 |
|
Europe |
18 939 |
- |
Discounted cash flow |
4.9 |
- |
19 895 |
- |
|
Logistics |
|||||||
|
US |
70 439 |
79 108 |
Discounted cash flow |
7.8 |
6.4 |
1 770 |
1 651 |
|
Europe |
36 946 |
33 963 |
Income capitalisation |
5.7 |
5.0 |
1 093 |
902 |
|
Tokyo |
|||||||
|
Office/Retail |
8 022 |
8 016 |
Discounted cash flow |
2.3 |
2.4 |
16 428 |
17 134 |
|
Other |
2 097 |
2 703 |
|||||
|
Total |
300 541 |
329 732 |
|||||
Unlisted renewable energy infrastructure (Level 3)
The fair value of unlisted infrastructure is determined as the sum of the underlying assets and liabilities as presented in note 7 Unlisted renewable energy infrastructure. The investments are valued by external, independent valuation specialists using bespoke valuation models. Valuation of unlisted infrastructure is dependent on significant forward-looking judgements. These include key assumptions and estimates with respect to each individual asset type, future revenue streams and relevant discount rates. These assumptions represent primarily unobservable inputs and Unlisted infrastructure is therefore classified as Level 3 in the fair value hierarchy.
Discount rates and assumptions regarding expected future revenue streams (power prices) are the most important inputs in the valuation models. Power prices are forecasted by independent, energy market forecasters.
Forecasted future cash flows are discounted with a discount rate using valuation models. The models take into account estimates of risk premiums both for the market in general and for the specific infrastructure assets. In addition, the external valuers also compare this value with value estimates calculated using market multiples (trading factors from similar companies) and transaction multiples (metrics from recent comparable transactions), before determining the final estimate of fair value.
Equities (Level 2 and Level 3)
Equities that are valued based on models with observable inputs are classified as Level 2 in the fair value hierarchy. These holdings are not traded in active markets. The valuation models take into account various observable market inputs such as comparable equity quotes, last traded price and volume.
Holdings in Level 3 consist of equities that are not listed or have been suspended from trading, where the valuation models use unobservable inputs to a significant extent. For equities that are suspended from trading, the value is adjusted down compared to last-traded price, based on an assessment of company and country-specific factors. For equities that are not listed, an adjustment for liquidity risk is applied. Valuation models for these holdings take into account unobservable inputs such as historical volatility, company performance and analysis of comparable companies and securities.
Russian equities constitute the majority of equity securities classified as Level 3 at year-end 2023. Trading in Russian securities is regulated by extensive sanctions. In order to estimate the price that would be received for the sale of the shares under current market conditions, a downward adjustment was applied to the last traded price of these securities at year-end. The downward adjustment reflects the estimated discount market participants would demand to reflect the risk associated with the inherent uncertainty in the cash flows of the shareholdings, as well as the inability to access a public market to trade the shares. The adjustment to the last traded price was based on unobservable inputs and is considered to be significant to the fair value measurement. All equity holdings where an adjustment has been applied to the last traded price were therefore classified as Level 3. At year-end 2023, these equity securities had a value of NOK 1.4 billion, compared to NOK 3 billion at year-end 2022.
Bonds (Level 2 and Level 3)
Bonds classified as Level 2 are valued using observable inputs from comparable issues, as well as direct indicative or executable quotes. These holdings usually consist of less liquid bonds than those classified as Level 1, i.e. where there is no trading volume of binding offers and a low volume of indicative quotes at the measurement date.
Bonds classified as Level 3 are valued based on models using unobservable inputs such as probability for future cash flows and spreads to reference curves. These holdings include defaulted and highly illiquid bonds.
Financial derivatives (Level 2 and Level 3)
Foreign exchange derivatives consist mainly of foreign exchange forward contracts, and are valued using industry standard models which use observable market data inputs such as forward rates.
Interest rate derivatives, which mainly consist of interest rate swaps, are valued using industry standard models with observable market data inputs such as interest from traded interest rate swaps.
Equity derivatives and credit derivatives, are mainly valued using observable prices provided by vendors according to the price hierarchy. In some cases where an equity derivative is not traded, inputs such as conversion factors, subscription price and strike price are utilised to value the instruments.
5. Sensitivity analysis for Level 3 holdings
The valuation of holdings in Level 3 involves the use of judgement when determining the assumptions that market participants would use when observable market data is not available. In the sensitivity analysis for Level 3 holdings, the effect of using reasonable alternative assumptions is shown.
Table 8.4 Additional specification Level 3 and sensitivities
|
Amounts in NOK million |
Key assumptions |
Change in key assumptions |
Specification of Level 3 holdings 31.12.2023 |
Sensitivities 31.12.2023 |
Change in key assumptions |
Specification of Level 3 holdings 31.12.2022 |
Sensitivities 31.12.2022 |
||
|---|---|---|---|---|---|---|---|---|---|
|
Unfavourable changes |
Favourable changes |
||||||||
|
Unfavourable changes |
Favourable changes |
||||||||
|
Equities |
Adjustment for country-specific factors Russia |
- |
1 358 |
-1 358 |
- |
- |
2 997 |
-2 997 |
- |
|
Suspension adjustment |
20.0 percent |
142 |
-28 |
28 |
20.0 percent |
209 |
-42 |
42 |
|
|
1 500 |
-1 386 |
28 |
3 206 |
-3 039 |
42 |
||||
|
Bonds |
Probability of future cash flows |
10.0 percent |
916 |
-90 |
90 |
10.0 percent |
340 |
-34 |
34 |
|
Financial derivatives (assets) |
Other |
4 |
-1 |
1 |
45 |
-9 |
9 |
||
|
Unlisted real estate |
Yield |
0.25 percentage point |
-14 818 |
16 879 |
0.20 percentage point |
-15 944 |
17 896 |
||
|
Market rent |
2.0 percent |
-5 400 |
5 419 |
2.0 percent |
-5 362 |
5 370 |
|||
|
300 541 |
-20 218 |
22 298 |
329 732 |
-21 306 |
23 266 |
||||
|
Unlisted infrastructure |
Discount rate |
0.25 percentage point |
-424 |
463 |
0.25 percentage point |
-312 |
287 |
||
|
Power price forecast |
5.0 percent |
-976 |
1 027 |
5.0 percent |
-804 |
780 |
|||
|
17 593 |
-1 400 |
1 490 |
14 489 |
-1 116 |
1 066 |
||||
|
Total |
320 554 |
-23 095 |
23 907 |
347 812 |
-25 504 |
24 417 |
|||
Unlisted real estate
Changes in key assumptions can have a material effect on the valuation. A number of key assumptions are used, of which yields and forecasts for future market rents are the assumptions that have the largest impact when estimating property values. This is illustrated in the sensitivity analysis by using other reasonable alternative assumptions for yield and market rents. At the end of 2023, a change in the yield of 0.25 percentage point, and a change in market rents of 2 percent is viewed as a reasonable range for alternative assumptions. At year-end 2022, a change in the yield of 0.20 percentage point, and a change in market rents of 2 percent was viewed as a reasonable range for alternative assumptions. The change in the range for yields is mainly to reflect the increased absolute yield level.
The sensitivity analysis is based on a statistically relevant sample that is representative for the unlisted real estate portfolio, and reflects both favourable and unfavourable changes. In an unfavourable outcome, it is estimated that an increase in the yield of 0.25 percentage point, and a reduction in market rents of 2 percent would result in a decrease in value of the unlisted real estate portfolio of approximately NOK 20 218 million or 6.7 percent (6.5 percent at year-end 2022). In a favourable outcome, a reduction in the yield of 0.25 percentage point and an increase in market rents of 2 percent would result in an increase in value of the unlisted real estate portfolio of approximately NOK 22 298 million or 7.4 percent (7.1 percent at year-end 2022). The isolated effects of changes in yields and future market rents are presented in table 8.4.
Changes outside of the ranges specified above are considered to be less reasonable alternative assumptions, however if the range of alternative assumptions were to be expanded, the value changes would be linear.
Unlisted renewable energy infrastructure
The sensitivity analysis for unlisted infrastructure is adapted to each individual investment. A number of key assumptions are used, of which discount rates and future power prices are the assumptions that have the largest impact when estimating values. This is illustrated in the sensitivity analysis by using other reasonable alternative assumptions for discount rates and future power prices.
Equities
Fair value of equities classified as Level 3 is sensitive to assumptions regarding whether trading will be resumed and how markets have moved from the time the trading was suspended, as well as specific factors related to the country and the individual company, such as trading restrictions and the company’s financial situation.
6. Control environment
The control environment for fair value measurement of financial instruments and investments in unlisted real estate and unlisted infrastructure is organised around a formalised and documented valuation policy and guidelines, supported by work and control procedures.
The valuation environment has been adapted in accordance with market standards and established valuation practices. This is implemented in practice through daily valuation of all holdings, except for investments in unlisted real estate and unlisted infrastructure, where valuations are performed quarterly. For unlisted real estate, the quarterly valuations are performed by external valuers. For unlisted infrastructure, external valuers perform the valuations at the end of the second and fourth quarters, while the internal valuation department performs the valuations at the end of the first and third quarters. These processes are scalable to market changes and are based on internal and external data solutions.
All holdings and investments are generally valued by external, independent price providers. These have been selected based on analyses performed by the departments responsible for valuation.
Price providers are monitored on an ongoing basis through regular discussions, controls and price challenges for individual securities. For a large portion of holdings, prices from independent price providers are based on quoted market prices. For holdings that are not sufficiently liquid for valuation to be based on quoted prices, models are used. Observable inputs are used where possible, but unobservable inputs are used in some cases, due to illiquid markets.
The valuation process is subject to numerous daily controls by the valuation departments. These controls are based on defined thresholds and sensitivities, which are monitored and adjusted in accordance with prevailing market conditions. At the end of each month for financial instruments and at the end of each quarter for investments in unlisted real estate and unlisted infrastructure, more extensive controls are performed to ensure the valuations represent fair value in accordance with IFRS. Particular attention is paid to illiquid financial instruments and unlisted investments, i.e. investments deemed to pose valuation challenges. Illiquid instruments are identified using sector and currency classifications, credit rating indicators, bid/ask spreads, and market activity.
Valuation memos and reports are prepared each quarter-end, documenting the results of the controls performed and the most important sources of uncertainty in the valuations. Prior to the publication of the financial reporting, the valuation documentation is reviewed, significant pricing issues are discussed, and the valuation is approved in the NBIM Leader Group Investment meeting.
Note 9 Investment risk
Management mandate for the GPFG
The GPFG is managed by Norges Bank on behalf of the Ministry of Finance, in accordance with section 3, second paragraph of the Government Pension Fund Act and the management mandate for the GPFG issued by the Ministry of Finance.
The GPFG shall seek to generate the highest possible return, net of costs, measured in the currency basket of the investment portfolio, within the applicable investment management framework. The strategic benchmark index set by the Ministry of Finance is divided into two asset classes, equities and bonds, with an allocation of 70 percent to equities and 30 percent to bonds.
The benchmark index for equities is constructed based on the market capitalisation for equities in the countries included in the benchmark. The benchmark index for bonds specifies a defined allocation between government bonds and corporate bonds, with a weight of 70 percent to government bonds and 30 percent to corporate bonds. The currency distribution is a result of these weighting principles.
Investments in unlisted real estate and unlisted renewable energy infrastructure are not defined by the fund’s benchmark index. The management mandate sets a maximum allocation to unlisted real estate of 7 percent of the investment portfolio. Investments in unlisted infrastructure can amount to up to 2 percent of the investment portfolio. The fund’s allocation to unlisted real estate and unlisted infrastructure is further regulated in the investment mandate issued by the Executive Board of Norges Bank. It is up to Norges Bank to determine the allocation to unlisted real estate and unlisted infrastructure within the limits set in the management mandate, and how this shall be financed.
The fund cannot invest in securities issued by Norwegian entities, securities issued in Norwegian kroner, or real estate and infrastructure located in Norway. The fund can also not invest in companies which are excluded following the guidelines for observation and exclusion from the GPFG.
Chart 9.1 Management mandate for the GPFG
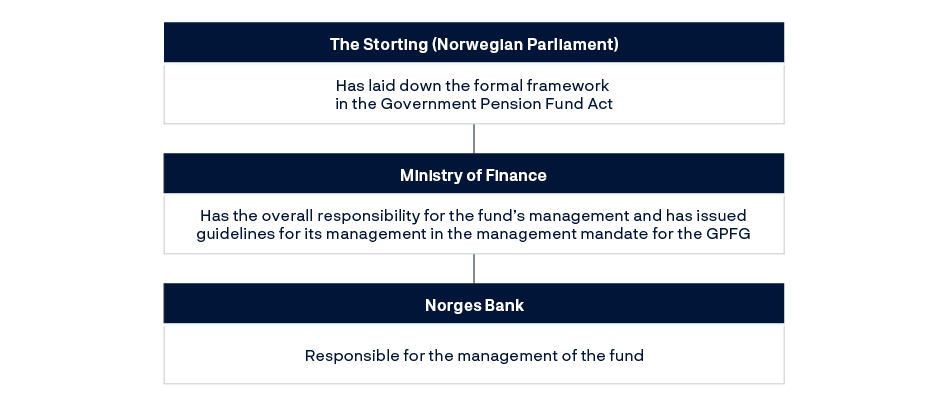
Norges Bank’s governance structure
The Executive Board of Norges Bank has delegated responsibility for the management of the GPFG to the Chief Executive Officer (CEO) of Norges Bank Investment Management.
The CEO of Norges Bank Investment Management is authorised through a job description and an investment mandate. The Executive Board has issued principles for, among other things, risk management, responsible investment and compensation to employees in Norges Bank Investment Management. Internationally recognised standards are applied in the areas of valuation and performance measurement as well as management, measurement and control of risk. Reporting to the Executive Board is carried out monthly, and more extensively on a quarterly basis. The Governor of Norges Bank and the Executive Board are notified immediately in the event of special events or significant matters.
Investment responsibilities within Norges Bank Investment Management are further delegated through investment mandates. Responsibility for processes and personnel is delegated through job descriptions, while process requirements are described in policies and guidelines. The composition of the leader group and the delegation of authority shall ensure segregation of duties between the investment areas, trading, operations, risk management and compliance and control.
Chart 9.2 Norges Bank’s governance structure
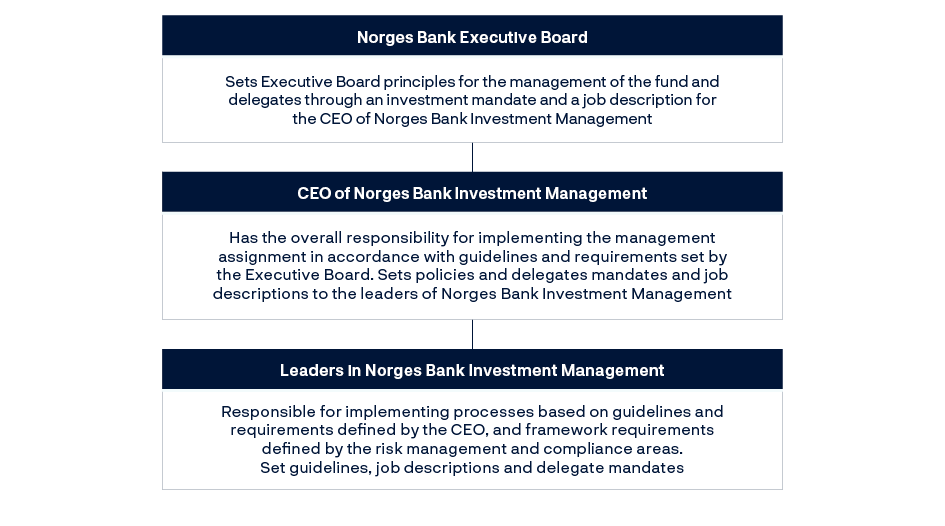
The NBIM Leader Group Investment Meeting complements the delegation of responsibility by advising on investment risk management and the portfolio’s investment universe.
Internal risk reporting requirements are set by the CEO of Norges Bank Investment Management, through job descriptions in the risk area. Reporting to the CEO is carried out on a daily, weekly and monthly basis. The CEO shall be notified immediately of any special events or serious breaches of the investment mandate.
Framework for investment risk
In the management mandate for the GPFG, there are a number of limits and restrictions within the combined equity and bond asset class, as well as within the individual asset classes. Investments in unlisted real estate and unlisted renewable energy infrastructure are regulated by a separate management framework in the investment mandate. The framework underpins how a diversified exposure to unlisted real estate and unlisted infrastructure shall be established and managed.
Clear roles and responsibilities are a cornerstone of process design at Norges Bank Investment Management. Changes to investment mandates, the portfolio hierarchy and new counterparties are monitored and require approval by the Chief Risk Officer (CRO), or a person authorised by the CRO.
The Executive Board’s principles for risk management are further described in policies and guidelines. Responsibility for effective processes related to risk management is delegated to the CRO and the Chief Corporate Governance & Compliance Officer.
Risk management is defined as the management of market risk, credit risk, counterparty risk, operational risk and risk related to environmental, social and governance factors. The first three items listed are defined as investment risk. The investment area in Norges Bank Investment Management is responsible for managing risk in the portfolio and in individual mandates, while the risk management areas independently measure, manage and report investment risk across the portfolio, at asset class level and other levels within the portfolio that reflect the investment process. Separate risk assessments are required in advance of investments in unlisted real estate and unlisted infrastructure.
Table 9.1 Investment risk
|
Type |
Market risk |
Credit risk |
Counterparty risk |
|---|---|---|---|
|
Definition |
Risk of loss or a change in the market value of the portfolio, or parts of the portfolio, due to changes in financial market variables, real estate and infrastructure values |
Risk of loss due to a bond issuer not meeting its payment obligations |
Risk of loss due to counterparty bankruptcy or other events leading to counterparties defaulting |
|
Main dimensions |
Measured both absolute and relative to the benchmark - Concentration risk - Volatility and correlation risk - Systematic factor risk - Liquidity risk |
Measured at single issuer and portfolio levels - Probability of default - Loss given default - Correlation between instruments and issuers at portfolio level |
Measured risk exposure by type of position - Securities lending - Unsecured bank deposits and securities - Derivatives including FX contracts - Repurchase and reverse repurchase agreements - Settlement risk towards brokers and long settlement transactions |
Investment risk – market risk
Norges Bank Investment Management defines market risk as the risk of loss or a change in the market value of the portfolio, or parts of the portfolio, due to changes in financial market variables, as well as real estate and infrastructure values. Market risk for the investment portfolio, both absolute and relative to the benchmark, is measured along the dimensions concentration risk, volatility and correlation risk, systematic factor risk and liquidity risk. For unlisted real estate, this involves measurement of the share of real estate under construction, vacancy, tenant concentration and geographical concentration. For unlisted infrastructure, this involves measurement of exposure towards different sectors, share of income from government subsidies, development exposure, and geographical concentration. Market risk is actively taken to generate investment returns in line with the objectives of the investment mandates.
Investment risk – credit risk
Norges Bank Investment Management defines credit risk as the risk of loss resulting from a bond issuer defaulting on their payment obligations. Credit risk is measured both in relation to single issuers, where the probability of default and loss given default are taken into account, and at portfolio level, where the correlation of credit losses between instruments and issuers is taken into account. Credit risk is actively taken to generate investment returns in line with the objectives of the investment mandates.
Investment risk – counterparty risk
Norges Bank Investment Management defines counterparty risk as the risk of loss due to counterparty bankruptcy or other events leading to counterparties defaulting. Counterparties are necessary to ensure effective liquidity management and effective trading and management of market and credit risk. Counterparty risk also arises in connection with securities lending and with the management of the equity and bond portfolios, as well as the real estate and infrastructure portfolios. Counterparty risk is controlled and limited to the greatest extent possible, given the investment strategy.
Risk management process
Norges Bank Investment Management employs several measurement methodologies, processes and systems to control investment risk. Robust and widely recognised risk management systems and processes are complemented by internally developed measurement methodologies and processes.
Market risk
Norges Bank Investment Management measures market risk in both absolute terms for the actual portfolio, and the relative market risk for holdings in the GPFG.
Continuous monitoring, measurement and assessment of market risk is performed along multiple risk dimensions, employing a number of methodologies and approaches. Combining different and complementary risk measures provides a better insight into the risk profile of the GPFG’s holdings.
Concentration risk
Concentration analysis complements statistical risk estimation by describing the concentration of a single exposure or a group of exposures. More concentrated portfolios tend to contribute to less diversification. Concentration is measured across different dimensions depending on the asset class, including country, currency, sector, issuer and company exposure.
The portfolio is invested across several asset classes, countries and currencies as shown in table 9.2.
Table 9.2 Allocation by asset class, country and currency
|
Asset class |
Market value in percent by country and currency1 |
Market value by asset class in percent |
Market value by asset class in NOK million |
||||||
|---|---|---|---|---|---|---|---|---|---|
|
31.12.2023 |
31.12.2022 |
||||||||
|
Market |
31.12.2023 |
Market |
31.12.2022 |
31.12.2023 |
31.12.2022 |
||||
|
Equities |
Developed |
89.8 |
Developed |
89.1 |
|||||
|
US |
48.8 |
US |
44.7 |
||||||
|
Japan |
7.2 |
Japan |
7.3 |
||||||
|
UK |
6.1 |
UK |
7.0 |
||||||
|
France |
4.3 |
France |
4.8 |
||||||
|
Switzerland |
4.1 |
Switzerland |
4.5 |
||||||
|
Total other |
19.4 |
Total other |
20.8 |
||||||
|
Emerging |
10.2 |
Emerging |
10.9 |
||||||
|
China |
3.1 |
China |
3.8 |
||||||
|
India |
2.2 |
India |
2.0 |
||||||
|
Taiwan |
2.1 |
Taiwan |
2.0 |
||||||
|
Brazil |
0.6 |
Brazil |
0.5 |
||||||
|
Mexico |
0.4 |
South Africa |
0.4 |
||||||
|
Total other |
1.9 |
Total other |
2.2 |
||||||
|
Total equities |
70.88 |
69.77 |
11 174 263 |
8 672 186 |
|||||
|
Fixed income |
Developed |
99.8 |
Developed |
99.7 |
|||||
|
US dollar |
51.2 |
US dollar |
50.2 |
||||||
|
Euro |
28.2 |
Euro |
28.1 |
||||||
|
Japanese yen |
6.9 |
Japanese yen |
8.0 |
||||||
|
British pound |
5.0 |
British pound |
4.5 |
||||||
|
Canadian dollar |
3.9 |
Canadian dollar |
3.8 |
||||||
|
Total other |
4.6 |
Total other |
5.1 |
||||||
|
Emerging2 |
0.2 |
Emerging2 |
0.3 |
||||||
|
Total fixed income |
27.10 |
27.45 |
4 271 746 |
3 412 044 |
|||||
|
Unlisted real estate |
US |
48.6 |
US |
51.8 |
|||||
|
UK |
18.7 |
France |
16.5 |
||||||
|
France |
15.7 |
UK |
16.4 |
||||||
|
Germany |
5.3 |
Germany |
5.0 |
||||||
|
Switzerland |
3.6 |
Switzerland |
3.4 |
||||||
|
Total other |
8.0 |
Total other |
7.0 |
||||||
|
Total unlisted real estate |
1.91 |
2.66 |
301 128 |
330 300 |
|||||
|
Total unlisted infrastructure |
0.11 |
0.12 |
17 660 |
14 530 |
|||||
|
Market value investment portfolio |
15 764 797 |
12 429 059 |
|||||||
1 Market value in percent by country and currency includes derivatives and cash. From 2023, market value is presented before management fee receivable and deferred tax. Up to and including 2022, market value was presented before management fee receivable.
2 The share of individual emerging market currencies in the fixed income portfolio is insignificant.
At the end of 2023, the equity portfolio’s share of the fund was 70.9 percent, up from 69.8 percent at year-end 2022. The bond portfolio’s share of the fund was 27.1 percent, down from 27.5 percent at year-end 2022. Unlisted real estate amounted to 1.9 percent of the fund at year-end, compared to 2.7 percent at year-end 2022. Unlisted infrastructure amounted to 0.1 percent of the fund at year-end, which was the same as year-end 2022.
For equity investments, concentration in the portfolio is further measured by sector. Table 9.3 shows the composition of the equity asset class by sector.
Table 9.3 Allocation of equity investments by sector, percent1
|
Sector |
31.12.2023 |
31.12.2022 |
|---|---|---|
|
Technology |
22.3 |
17.5 |
|
Financials |
15.0 |
15.8 |
|
Consumer discretionary |
14.1 |
13.3 |
|
Industrials |
13.1 |
13.1 |
|
Health care |
11.1 |
12.7 |
|
Consumer staples |
5.6 |
6.6 |
|
Real estate |
5.5 |
5.5 |
|
Basic materials |
4.0 |
4.4 |
|
Energy |
3.7 |
4.4 |
|
Telecommunications |
3.3 |
3.1 |
|
Utilities |
2.4 |
2.7 |
1 Does not sum up to 100 percent because cash and derivatives are not included.
The GPFG has substantial investments in government-issued bonds. Table 9.4 shows the largest holdings in bonds issued by governments. These include government bonds issued in local and foreign currency and inflation-linked bonds issued in local currency.
Table 9.4 Largest holdings within the segment government bonds
|
Amounts in NOK million |
Market value 31.12.2023 |
Amounts in NOK million |
Market value 31.12.2022 |
|
|---|---|---|---|---|
|
US |
1 344 708 |
US |
1 022 086 |
|
|
Japan |
362 637 |
Japan |
475 342 |
|
|
Singapore |
225 902 |
Germany |
171 336 |
|
|
Germany |
201 925 |
Singapore |
155 332 |
|
|
UK |
152 941 |
UK |
106 701 |
|
|
Canada |
85 209 |
France |
73 898 |
|
|
France |
79 170 |
Canada |
64 837 |
|
|
Italy |
60 385 |
Italy |
63 415 |
|
|
Netherlands |
52 858 |
Australia |
44 187 |
|
|
Spain |
49 664 |
Spain |
31 959 |
The portfolio is also invested in companies which issue both equities and bonds. Table 9.5 shows the portfolio’s largest holdings of non-government issuers, including both bond and equity holdings. Covered bonds issued by financial institutions and debt issued by other underlying companies are included in the bonds column.
Table 9.5 Largest holdings excluding sovereigns, both bonds and equities
|
Amounts in NOK million, 31.12.2023 |
Sector |
Equities |
Bonds |
Total |
|---|---|---|---|---|
|
Microsoft Corp |
Technology |
358 388 |
1 717 |
360 105 |
|
Apple Inc |
Technology |
337 297 |
5 631 |
342 929 |
|
Alphabet Inc |
Technology |
195 493 |
1 948 |
197 440 |
|
Amazon.com Inc |
Consumer discretionary |
177 283 |
6 596 |
183 879 |
|
NVIDIA Corp |
Technology |
145 855 |
3 230 |
149 085 |
|
Meta Platforms Inc |
Technology |
113 120 |
4 198 |
117 318 |
|
Nestlé SA |
Consumer staples |
91 221 |
1 527 |
92 747 |
|
Taiwan Semiconductor Manufacturing Co Ltd |
Technology |
89 218 |
- |
89 218 |
|
Novo Nordisk A/S |
Health care |
88 694 |
- |
88 694 |
|
JPMorgan Chase & Co |
Financials |
59 877 |
22 686 |
82 563 |
|
Amounts in NOK million, 31.12.2022 |
Sector |
Equities |
Bonds |
Total |
|---|---|---|---|---|
|
Apple Inc |
Technology |
209 674 |
9 662 |
219 336 |
|
Microsoft Corp |
Technology |
199 878 |
1 581 |
201 459 |
|
Alphabet Inc |
Technology |
110 219 |
1 717 |
111 936 |
|
Nestlé SA |
Consumer staples |
88 149 |
1 994 |
90 143 |
|
Amazon.com Inc |
Consumer discretionary |
80 207 |
9 260 |
89 466 |
|
Roche Holding AG |
Health care |
62 055 |
1 498 |
63 554 |
|
Shell PLC |
Energy |
60 710 |
272 |
60 982 |
|
Taiwan Semiconductor Manufacturing Co Ltd |
Technology |
60 040 |
- |
60 040 |
|
Bank of America Corp |
Financials |
33 303 |
25 468 |
58 771 |
|
Berkshire Hathaway Inc |
Financials |
51 834 |
6 169 |
58 003 |
Table 9.6 shows the composition of the unlisted real estate asset class by sector.
Table 9.6 Distribution of unlisted real estate investments by sector, percent
|
Sector |
31.12.2023 |
31.12.2022 |
|---|---|---|
|
Office |
52.0 |
53.7 |
|
Retail |
11.9 |
11.7 |
|
Logistics |
35.7 |
34.2 |
|
Other |
0.4 |
0.4 |
|
Total |
100.0 |
100.0 |
Volatility and correlation risk
Norges Bank Investment Management uses models to quantify the risk of fluctuations in value for all or parts of the portfolio. Volatility is a standard risk measure based on the statistical concept of standard deviation, which takes into account the correlation between different investments in the portfolio. Expected volatility is defined as one standard deviation. This risk measure gives an estimate of how much one can expect the portfolio’s value to change or fluctuate during the course of a year, based on market conditions over the past three years. In two of three years, the portfolio return is expected to be within the negative and positive value of the estimated volatility. Expected volatility can be expressed in terms of the portfolio’s absolute or relative risk. Norges Bank Investment Management uses the same model both for portfolio risk and for relative volatility.
All the fund’s investments are included in the calculation of expected relative volatility and are measured against the fund’s benchmark index consisting of global equity and bond indices.
The modelling of unlisted investments is challenging due to few or no historical prices. For investments in unlisted real estate, the exposure to a group of relevant risk factors is mapped to the model framework in MSCI’s Barra Private Real Estate 2 (PRE2) model. These are decided by key attributes such as location and property type. The model uses time series of valuations and actual transactions as a starting point, but also includes listed real estate share prices to establish representative, daily time series. For investments in unlisted infrastructure, the starting point is a combination of time series available in the existing framework for listed markets. The exposure to generic, listed risk factors is mapped for each project based on attributes such as share of contractually agreed prices, project lifetime, project phase, sector, country, and the quality of counterparties.
The risk model from MSCI then uses these factors for unlisted investments in the same way as ordinary equity and fixed-income risk factors, to calculate expected absolute and relative volatility, as well as expected shortfall for the fund’s investments.
Calculation of expected volatility
Expected volatility for the portfolio, and volatility relative to the benchmark index, is estimated by using a parametric calculation method based on current investments. The model weights weekly return data equally over a sampling period of three years.
Tables 9.7 and 9.8 present risk both in terms of the portfolio’s absolute risk and relative risk.
Table 9.7 Portfolio risk, expected volatility, percent
|
Expected volatility, actual portfolio |
||||||||
|---|---|---|---|---|---|---|---|---|
|
31.12.2023 |
Min 2023 |
Max 2023 |
Average 2023 |
31.12.2022 |
Min 2022 |
Max 2022 |
Average 2022 |
|
|
Portfolio |
10.3 |
8.7 |
10.8 |
9.7 |
10.1 |
9.6 |
10.4 |
10.1 |
|
Equities |
12.5 |
11.3 |
15.0 |
12.4 |
14.2 |
13.8 |
14.4 |
14.2 |
|
Fixed income |
10.8 |
9.8 |
11.2 |
10.4 |
11.1 |
10.0 |
11.1 |
10.7 |
|
Unlisted real estate |
12.9 |
11.8 |
12.9 |
12.4 |
12.1 |
11.7 |
12.4 |
12.0 |
|
Unlisted infrastructure |
34.0 |
14.9 |
40.0 |
32.1 |
14.9 |
8.9 |
14.9 |
11.7 |
Table 9.8 Relative risk measured against the fund’s reference index, expected relative volatility, basis points
|
Expected relative volatility |
||||||||
|---|---|---|---|---|---|---|---|---|
|
31.12.2023 |
Min 2023 |
Max 2023 |
Average 2023 |
31.12.2022 |
Min 2022 |
Max 2022 |
Average 2022 |
|
|
Portfolio |
34 |
33 |
41 |
36 |
39 |
39 |
53 |
45 |
Risk measured as expected volatility indicates an expected annual value fluctuation in the fund of 10.3 percent, or approximately NOK 1 620 billion at the end of 2023, compared to 10.1 percent at year-end 2022. Expected volatility for the equity portfolio was 12.5 percent at year-end, down from 14.2 percent at year-end 2022, while expected volatility for the fixed-income portfolio was 10.8 percent, down from 11.1 percent at year-end 2022.
The management mandate specifies that expected relative volatility for the fund shall not exceed 1.25 percentage points. The measurement of risk and follow-up of the limit is performed based on the risk model described above. The fund’s expected relative volatility was 34 basis points at the end of the year, down from 39 basis points at year-end 2022. The decrease in the fund’s expected relative volatility in 2023 is mainly due to reduced expected relative volatility from real estate investments.
In addition to the above-mentioned model, other risk models are employed that capture the market dynamics of recent periods to a greater extent, as well as models that measure tail risk.
Expected shortfall is a tail risk measure that quantifies the expected loss of a portfolio in extreme market situations. Expected shortfall measured on relative returns provides an estimate of the annual expected relative underperformance versus the benchmark index for a given confidence level. Using historical simulations, relative returns of the current portfolio compared to the benchmark index are calculated on a weekly basis over a sampling period from January 2007 until the end of the last accounting period. The expected shortfall at a 97.5 percent confidence level is then given by the annualised average relative return, measured in the currency basket for the 2.5 percent worst weeks.
The Executive Board has determined that the fund shall be managed in such a way that the annual expected shortfall measured against the benchmark index does not exceed 3.75 percentage points. Expected shortfall is measured and monitored based on the risk model described above. At the end of the year, expected shortfall was 1.08 percentage points, compared to 1.22 percentage points at year-end 2022.
Calculation of expected shortfall
Expected shortfall for the portfolio, measured against its benchmark index, is estimated using historical simulations based on current investments. The model weights weekly returns equally over a sampling period from January 2007 until the end of the last accounting period, so that the measure can capture extreme market movements. A confidence level of 97.5 percent is used for the calculations.
Strengths and weaknesses
The strength of these types of risk model is that one can estimate the risk associated with a portfolio across different asset classes, markets, currencies, securities and derivatives, and express this risk as a single numerical value, which takes into account the correlation between different asset classes, securities and risk factors, as well as capturing deviations from a normal distribution.
The model-based risk estimates are based on historical relationships in the markets and are expected to provide reliable forecasts in markets without significant changes in volatility and correlation. Estimates will be less reliable in periods marked by significant changes in volatility and correlation. Calculated volatility gives a point estimate of risk and provides little information on the total risk profile and any tail risk. Annualisation means that it is assumed that volatility and the composition of the portfolio are constant over time. To compensate for these shortcomings, complementary models and methods are employed, such as stress tests and analyses of concentration risk and realised returns.
Verification of models
Risk models used in estimating and controlling investment risk are continuously evaluated and verified for their ability to estimate risk. The special nature of the investment portfolio and the investment universe, as well as the GPFG’s long-term investment horizon, are taken into account when evaluating the models.
Credit risk
Credit risk is the risk of losses resulting from issuers of bonds defaulting on their payment obligations. Fixed-income instruments in the portfolio’s benchmark index are all rated investment grade by one of the major credit rating agencies. Investments in bonds are made based on internal assessments with regards to expected return and risk profile.
Table 9.9 Bond portfolio specified by credit rating
|
Amounts in NOK million, 31.12.2023 |
AAA |
AA |
A |
BBB |
Lower rating |
Total |
|---|---|---|---|---|---|---|
|
Government bonds |
612 472 |
1 456 325 |
406 747 |
80 433 |
36 233 |
2 592 210 |
|
Government-related bonds |
198 601 |
149 019 |
34 615 |
22 373 |
2 369 |
406 977 |
|
Inflation-linked bonds |
48 794 |
193 647 |
24 943 |
15 752 |
- |
283 137 |
|
Corporate bonds |
8 977 |
66 905 |
460 349 |
455 568 |
10 487 |
1 002 288 |
|
Securitised bonds |
239 362 |
41 931 |
1 812 |
- |
- |
283 106 |
|
Total bonds1 |
1 108 207 |
1 907 827 |
928 467 |
574 127 |
49 090 |
4 567 718 |
|
Amounts in NOK million, 31.12.2022 |
AAA |
AA |
A |
BBB |
Lower rating |
Total |
|---|---|---|---|---|---|---|
|
Government bonds |
1 365 320 |
192 142 |
509 240 |
75 988 |
22 914 |
2 165 605 |
|
Government-related bonds |
173 893 |
136 251 |
51 670 |
18 168 |
1 867 |
381 848 |
|
Inflation-linked bonds |
154 708 |
58 278 |
14 368 |
16 087 |
- |
243 441 |
|
Corporate bonds |
7 761 |
61 407 |
366 585 |
383 325 |
10 236 |
829 314 |
|
Securitised bonds |
198 124 |
34 817 |
1 677 |
- |
- |
234 618 |
|
Total bonds |
1 899 805 |
482 896 |
943 540 |
493 569 |
35 018 |
3 854 827 |
1 At year-end 2023, bonds received as collateral amounting to NOK 2.6 billion were sold. These bonds are presented in the balance sheet as a liability under Secured borrowing.
The market value of the bond portfolio increased to NOK 4 568 billion at year-end 2023, from NOK 3 855 billion at year-end 2022. The share of holdings in corporate bonds increased by 0.4 percentage point during the year, to 21.9 percent of the bond portfolio at year-end 2023. Government bonds, including inflation-linked bonds, comprised 62.9 percent of the bond portfolio at year-end, an increase of 0.4 percentage point compared to year-end 2022.
The share of bonds with credit rating AAA decreased by 25.0 percentage points during the year, to 24.3 percent of the total bond portfolio at year-end 2023. The decrease is mainly due to USA being downgraded to AA from category AAA. This led to an increase in category AA to 41.8 percent of the bond portfolio at year end 2023, from 12.5 percent at year end 2022. The share of bonds with credit rating BBB decreased by 0.2 percentage point compared to year-end 2022, to 12.6 percent at year-end 2023.
The share of bonds in the Lower rating category increased to 1.1 percent at year-end 2023, from 0.9 percent at year-end 2022. This was mainly due to an increase in the share of Brazilian government bonds in the Lower rating category. Defaulted bonds had a market value of NOK 23 million at year-end 2023, compared to NOK 27 million at year-end 2022. Defaulted bonds are grouped under Lower rating.
Table 9.10 Bond portfolio by credit rating and currency, percent
|
31.12.2023 |
AAA |
AA |
A |
BBB |
Lower rating |
Total |
|---|---|---|---|---|---|---|
|
US dollar |
0.8 |
31.3 |
7.1 |
6.9 |
0.1 |
46.1 |
|
Euro |
11.7 |
5.1 |
4.2 |
4.0 |
0.1 |
25.1 |
|
Japanese yen |
- |
- |
8.0 |
- |
- |
8.0 |
|
Singapore dollar |
4.9 |
- |
- |
- |
- |
4.9 |
|
Canadian dollar |
3.1 |
0.8 |
0.5 |
- |
- |
4.7 |
|
Other currencies |
3.7 |
4.6 |
0.5 |
1.4 |
0.8 |
11.1 |
|
Total |
24.3 |
41.8 |
20.3 |
12.6 |
1.1 |
100.0 |
|
31.12.2022 |
AAA |
AA |
A |
BBB |
Lower rating |
Total |
|---|---|---|---|---|---|---|
|
US dollar |
27.5 |
2.1 |
7.1 |
7.1 |
0.2 |
44.0 |
|
Euro |
10.9 |
5.6 |
3.5 |
4.2 |
0.1 |
24.4 |
|
Japanese yen |
- |
- |
12.8 |
- |
- |
12.8 |
|
Canadian dollar |
2.9 |
0.7 |
0.3 |
0.2 |
- |
4.1 |
|
Singapore dollar |
4.0 |
- |
- |
- |
- |
4.0 |
|
Other currencies |
3.9 |
4.0 |
0.7 |
1.4 |
0.6 |
10.7 |
|
Total |
49.3 |
12.5 |
24.5 |
12.8 |
0.9 |
100.0 |
At year-end 2023, investments had been made in purchased credit default swaps with a nominal value of NOK 52.3 billion, a small decrease from NOK 53.3 billion at year-end 2022. 29 percent of these were in the category where the underlying issuers have a low credit rating. See table 5.3 in note 5 Holdings of equities, bonds and financial derivatives for further information. When investing in purchased credit default swaps, the credit risk in the bond portfolio is reduced when the portfolio has investments in the same underlying bonds as the credit default swaps. At year-end 2023, credit risk exposure was reduced by NOK 23.7 billion as a result of purchased credit default swaps, compared to a reduction of NOK 28.5 billion at year-end 2022.
In addition to credit ratings from credit rating agencies, measurement of credit risk is complemented by two credit risk models, of which one is based on credit ratings and the other is based on observable credit premiums. Both of these methods also take into account the correlation and expected value of bonds in a bankruptcy situation. The models also take into account credit default swaps, and these reduce or increase the credit risk depending on whether credit risk is bought or sold. The models are used for risk measurement and monitoring of credit risk in the fixed-income portfolio. The overall credit quality of the bond portfolio deteriorated slightly during the year.
Counterparty risk
Counterparties are necessary to trade in the markets and to ensure effective management of liquidity, market and credit risk. Exposure to counterparty risk is related to trading in derivatives and foreign exchange contracts, securities lending, and repurchase and reverse repurchase agreements. Counterparty risk also arises from unsecured bank deposits and in connection with the daily liquidity management of the fund, as well as purchases and sales of unlisted real estate and unlisted infrastructure. Furthermore, there is exposure to counterparty risk related to counterparties in the international settlement and custody systems where transactions settle. This can occur both for currency trades and for the purchase and sale of securities. Settlement risk and exposure from trades with a long settlement period are also defined as counterparty risk.
Various counterparties are used to reduce concentration and there are strict requirements for counterparty credit rating. Credit rating requirements are generally higher for counterparties to unsecured deposits in banks than in cases where collateral is received. Changes in counterparty credit ratings are monitored continuously.
Netting agreements are in place for trades in OTC derivatives, currency contracts, as well as repurchase and reverse repurchase agreements, in order to reduce counterparty risk. Many derivatives are also cleared, meaning that the counterparty risk is mainly towards the clearing house instead of banks. Further reduction of counterparty risk is achieved through requirements for collateral for counterparty net positions with a positive market value. For instruments where collateral is used, minimum requirements have been set relating to the credit quality, time to maturity and concentration of the collateral. Netting and collateral agreements are entered into for all approved counterparties for these types of trades.
There are also requirements governing the way real estate and infrastructure transactions are conducted in order to ensure acceptable counterparty risk. Counterparty risk that arises during the acquisition process is analysed in advance of the transaction and requires approval by the CRO. In 2023, 8 real estate transactions were analysed and approved by the CRO through this process, compared to 13 transactions in 2022. In 2023, 2 investments in unlisted infrastructure were analysed and approved by the CRO through this process. No investments were made in unlisted infrastructure in 2022.
Counterparty risk is also limited by setting exposure limits for individual counterparties. In most instances, the exposure limit is determined by the credit rating of the counterparty, where counterparties with strong credit rating have a higher limit than counterparties with weaker credit rating. Exposure per counterparty is measured daily against limits set by the Executive Board and the CEO of Norges Bank Investment Management.
The methodologies used to calculate counterparty risk are in accordance with internationally recognised standards. As a rule, the Basel regulations for banks are used for measuring counterparty risk, with certain adjustments based on internal analyses. The risk model calculates the expected counterparty exposure in the event of a counterparty default. The Standardised Approach in the Basel regulations (SA-CCR) is used for derivatives and foreign exchange contracts. The Standardised Approach takes into account collateral received and netting arrangements when calculating counterparty risk.
For repurchase agreements, securities lending transactions executed through an external agent and securities posted as collateral in derivative trades, a method is used that adds a premium to the market value to reflect the position’s volatility. When determining counterparty risk exposure for these positions, an adjustment is also made for netting and actual collateral received and posted.
Exposure to counterparty risk is related to counterparties in the settlement and custody systems, both for currency trades and for the purchase and sale of securities. Settlement risk is reduced using the currency settlement system CLS (Continuous Linked Settlement), or by trading directly with the settlement bank. For some currencies, Norges Bank is exposed to settlement risk when the sold currency is delivered to the counterparty before the receipt of currency is confirmed. This type of exposure is included on the line Settlement risk towards brokers and long settlement transactions in table 9.11.
In table 9.11, exposure is broken down by type of activity/instrument associated with counterparty risk.
Total counterparty risk increased to NOK 212.0 billion at year-end 2023, from NOK 172,0 billion at year-end 2022, an increase of 23.3 percent. The largest increase in counterparty risk exposure came from derivatives, including foreign exchange contracts, which amounted to NOK 30.2 billion in 2023, and was largest for futures and foreign exchange contracts. The increase was mainly due to increased activity in these instruments. There was also an increase in risk exposure from repurchase and reverse repurchase agreements at year-end 2023 compared to year-end 2022. This is mainly due to increased lending activity at year-end 2023.
Counterparty risk exposure from the securities lending programme increased to NOK 66.8 billion at year-end 2023, from NOK 62.3 billion at year-end 2022. The increase was mainly due to higher bond lending in the programme at year-end 2023. Both equities and bonds are lent through the securities lending programme. Counterparty risk exposure from securities lending accounted for 31.5 percent of the fund’s total counterparty risk exposure at the end of 2023, compared to 36.2 percent at the end of 2022.
Table 9.11 Counterparty risk by type of position
|
Amounts in NOK million |
Risk exposure |
|
|---|---|---|
|
31.12.2023 |
31.12.2022 |
|
|
Derivatives including foreign exchange contracts |
102 476 |
72 319 |
|
Securities lending |
66 750 |
62 291 |
|
Unsecured bank deposits1 and securities |
20 188 |
21 662 |
|
Repurchase and reverse repurchase agreements |
19 798 |
13 986 |
|
Settlement risk towards brokers and long settlement transactions |
2 798 |
1 699 |
|
Total |
212 011 |
171 956 |
1 Includes bank deposits in non-consolidated subsidiaries.
Norges Bank’s counterparties have a credit rating from independent credit rating agencies or a documented internal credit rating. Credit ratings for counterparties are monitored and complemented by alternative credit risk indicators.
Table 9.12 shows approved counterparties classified by credit rating category. The table also includes brokers that are used when purchasing and selling securities.
Table 9.12 Counterparties by credit rating1
|
Norges Bank's counterparties (excluding brokers) |
Brokers |
|||
|---|---|---|---|---|
|
31.12.2023 |
31.12.2022 |
31.12.2023 |
31.12.2022 |
|
|
AAA |
3 |
3 |
1 |
1 |
|
AA |
38 |
38 |
40 |
34 |
|
A |
70 |
62 |
89 |
87 |
|
BBB |
9 |
11 |
33 |
31 |
|
BB |
2 |
2 |
23 |
22 |
|
B |
- |
- |
5 |
4 |
|
Total |
122 |
116 |
191 |
179 |
1 The table shows the number of legal entities. The same legal entity can be included as both broker and counterparty.
The number of counterparties and brokers increased slightly during the year. There were 122 counterparties at year-end 2023, compared to 116 at year-end 2022. The number of brokers increased to 191 at year-end 2023, from 179 at year-end 2022. The overall credit quality of brokers and counterparties remained unchanged from year-end 2022.
Leverage
Leverage may be used to ensure effective management of the investments within the equity and bond portfolios, but not with the aim of increasing the economic exposure to risky assets. The use of leverage is regulated in both the management mandate and the investment mandate. Leverage is the difference between total net exposure and market value of the portfolio. Net exposure is determined by including securities at market value, cash at face value and positions in derivatives by converting them to the underlying exposure. When the exposure is greater than market value, the portfolio is leveraged.
The GPFG’s leverage was 1.5 percent for the aggregated equity and bond portfolio at the end of 2023, compared to 2.8 percent at the end of 2022. For investments in unlisted real estate, requirements are set in the investment mandate, limiting the maximum leverage of the portfolio to 35 percent. The unlisted real estate investments had a debt ratio of 7.8 percent at the end of 2023, compared to 7.6 percent at the end of 2022. At year-end 2023, there was no external debt for the unlisted infrastructure investments.
Sale of securities Norges Bank does not own
Sale of securities not owned by Norges Bank (short sales) can only be carried out if there are established borrowing agreements to cover a negative position. Such transactions were used to a limited extent in 2023.
Note 10 Tax
Accounting policy
Norges Bank is exempt from income tax on its operations in Norway, but is subject to taxes in a number of foreign jurisdictions. Tax expense in the income statement represents income taxes that are not reimbursed through local tax laws or treaties, and consists of taxes on dividends, interest income and capital gains related to investments in equities and bonds, tax on fee income from secured lending and taxes in consolidated subsidiaries. The majority of these taxes are collected at source.
Withholding taxes, net of deductions for refundable amounts, are recognised at the same time as the related dividend or interest income. See the accounting policy in note 4 Income/expense from equities, bonds and financial derivatives.
Other income tax, which is not collected at source, is recognised in the income statement in the same period as the related income or gain and presented in the balance sheet as a liability within Other liabilities, until it has been settled. Deferred tax in the balance sheet mainly consists of capital gains tax. Capital gains tax is recognised as a liability based on the expected future payment when the GPFG is in a gain position in the applicable market. No deferred tax asset is presented in the balance sheet when the GPFG is in a loss position, since the recognition criteria are not considered to be met.
Tax incurred in subsidiaries presented in the balance sheet lines Unlisted real estate and Unlisted infrastructure is recognised in the income statement as Income/expense from unlisted real estate and Income/expense from unlisted infrastructure, respectively. Only the tax expense in consolidated subsidiaries is included in the income statement line Tax expense. This is specified in table 10.1 in the line Other.
The rules on global minimum taxation (Pillar 2) are expected to be implemented in Norway with effect from 2024. The current assessment is that the fund will be exempt from the scope of application. Therefore, no change in the fund’s tax cost is expected as a result of the implementation.
All uncertain tax positions, such as disputed withholding tax refunds, are assessed each reporting period. The best estimate of the probable reimbursement or payment is recognised in the balance sheet.
Table 10.1 shows tax expense by type of investment and type of tax.
Table 10.1 Specification tax expense
|
Amounts in NOK million, 2023 |
Gross income before taxes |
Income tax on dividends, interest and fees |
Capital gains tax |
Other |
Tax expense |
Net income after taxes |
|---|---|---|---|---|---|---|
|
Income/expense from: |
||||||
|
Equities |
2 030 561 |
-7 533 |
-5 818 |
- |
-13 351 |
2 017 210 |
|
Bonds |
231 769 |
-20 |
- |
- |
-20 |
231 749 |
|
Secured lending |
9 922 |
-165 |
- |
- |
-165 |
9 757 |
|
Other |
- |
- |
- |
-19 |
-19 |
- |
|
Tax expense |
-7 718 |
-5 818 |
-19 |
-13 555 |
|
Amounts in NOK million, 2022 |
Gross income before taxes |
Income tax on dividends, interest and fees |
Capital gains tax |
Other |
Tax expense |
Net income after taxes |
|---|---|---|---|---|---|---|
|
Income/expense from: |
||||||
|
Equities |
-1 201 835 |
-4 347 |
-266 |
- |
-4 613 |
-1 206 448 |
|
Bonds |
-453 128 |
-25 |
- |
- |
-25 |
-453 153 |
|
Secured lending |
4 845 |
-202 |
- |
- |
-202 |
4 643 |
|
Other |
- |
- |
- |
-9 |
-9 |
- |
|
Tax expense |
-4 574 |
-266 |
-9 |
-4 850 |
Table 10.2 shows receivables and liabilities recognised in the balance sheet related to tax.
Table 10.2 Specification balance sheet items related to tax
|
Amounts in NOK million |
31.12.2023 |
31.12.2022 |
|---|---|---|
|
Withholding tax receivable |
10 522 |
8 937 |
|
Tax payable1 |
15 |
12 |
|
Deferred tax |
8 246 |
4 488 |
1 Included within the balance sheet line Other liabilities.
Table 10.3 specifies the line Net payment of taxes in the statement of cash flows.
Table 10.3 Specification net payment of taxes
|
Amounts in NOK million |
2023 |
2022 |
|---|---|---|
|
Receipt of refunded withholding tax |
8 231 |
6 617 |
|
Payment of taxes |
-19 405 |
-17 676 |
|
Net payment of taxes |
-11 173 |
-11 058 |
Note 11 Foreign exchange gains and losses
In accordance with the management mandate, the fund is not invested in securities issued by Norwegian companies, securities denominated in Norwegian kroner nor real estate or infrastructure located in Norway. The fund’s returns are measured primarily in the fund’s currency basket, which is a weighted combination of the currencies in the fund’s benchmark index for equities and bonds. The fund’s market value in Norwegian kroner is impacted by changes in exchange rates, but this has no bearing on the fund’s international purchasing power.
Accounting judgement
The management of Norges Bank has concluded that the Norwegian krone is the bank’s functional currency, since this currency is dominant for the bank’s underlying activities. Owner’s equity, in the form of the GPFG krone account, is denominated in Norwegian kroner and a share of the costs related to management of the GPFG is incurred in Norwegian kroner. Returns on the investment portfolio are reported both internally and to the owner in Norwegian kroner, while the percentage return is measured both in Norwegian kroner and in the currency basket defined by the Ministry of Finance. Furthermore, there is no single investment currency that stands out as dominant within the investment management.
Accounting policy
Foreign currency transactions are recognised in the financial statements using the exchange rate prevailing on the transaction date. Assets and liabilities in foreign currencies are translated into Norwegian kroner using the exchange rate at the balance sheet date. The foreign exchange element linked to realised and unrealised gains and losses on assets and liabilities is disaggregated in the income statement and presented on a separate line, Foreign exchange gain/loss. This presentation is considered to provide the best informational value, based on the objective of the investment strategy of the GPFG which is to maximise the international purchasing power of the fund.
Accounting policy
Gains and losses on financial instruments are due to changes in the price of the instrument (security element) and changes in foreign exchange rates (foreign exchange element). These are presented separately in the income statement. The method used to allocate the total gain/loss in Norwegian kroner to a security element and a foreign exchange element is described below.
Foreign exchange element
Unrealised gain/loss due to changes in foreign exchange rates is calculated based on the cost of the holding in foreign currency and the change in the exchange rate from the time of purchase until the balance sheet date. If the holding has been purchased in a prior period, previously recognised gain/loss is deducted to arrive at the gain/loss in the current period. Upon realisation, the exchange rate on the date of sale is used when calculating the realised gain/loss.
Security element
Unrealised gain/loss due to changes in the security price is calculated based on the change in the security price from the purchase date to the balance sheet date, and the exchange rate at the balance sheet date. If the holding has been purchased in a prior period, previously recognised gain/loss is deducted to arrive at the gain/loss in the current period. Upon realisation, the selling price is used when calculating the realised gain/loss.
The change in the fund’s market value due to changes in foreign exchange rates is presented in table 11.1.
Table 11.1 Specification foreign exchange gain/loss
|
Amounts in NOK million |
2023 |
2022 |
|---|---|---|
|
Foreign exchange gain/loss - USD/NOK |
114 262 |
445 752 |
|
Foreign exchange gain/loss - EUR/NOK |
150 575 |
100 638 |
|
Foreign exchange gain/loss - GBP/NOK |
64 611 |
-6 685 |
|
Foreign exchange gain/loss - JPY/NOK |
-33 765 |
-11 871 |
|
Foreign exchange gain/loss - CHF/NOK |
43 197 |
28 912 |
|
Foreign exchange gain/loss - other |
70 561 |
85 104 |
|
Foreign exchange gain/loss |
409 441 |
641 850 |
Table 11.2 gives an overview of the distribution of the market value of the investment portfolio for the main currencies the GPFG is exposed to. This supplements the overview of the allocation by asset class, country and currency shown in table 9.2 in note 9 Investment risk.
Table 11.2 Specification of the investment portfolio by currency
|
Amounts in NOK million |
31.12.2023 |
31.12.2022 |
|---|---|---|
|
US dollar |
7 765 611 |
5 706 838 |
|
Euro |
2 836 773 |
2 301 709 |
|
British pound |
1 079 685 |
936 868 |
|
Japanese yen |
939 710 |
804 707 |
|
Swiss franc |
593 279 |
502 895 |
|
Other currencies1 |
2 549 740 |
2 176 043 |
|
Market value investment portfolio |
15 764 797 |
12 429 059 |
1 From 2023, Deferred tax is not included as part of the investment portfolio.
Table 11.3 gives an overview of exchange rates at the balance sheet date for the main currencies the GPFG is exposed to.
Table 11.3 Exchange rates
|
31.12.2023 |
31.12.2022 |
Percent change |
|
|---|---|---|---|
|
US dollar |
10.17 |
9.85 |
3.3 |
|
Euro |
11.24 |
10.51 |
6.9 |
|
British pound |
12.93 |
11.85 |
9.2 |
|
Japanese yen |
0.07 |
0.07 |
-3.7 |
|
Swiss franc |
12.14 |
10.65 |
14.0 |
Note 12 Management costs
Accounting policy
Management fee is recognised in the GPFG’s income statement as an expense when incurred.
Performance-based fees to external managers are based on achieved excess returns relative to the applicable benchmark index over time. The provision for performance-based fees is based on the best estimate of the incurred fee to be paid. The effect of changes in estimates is recognised in profit or loss in the current period.
Management costs comprise all costs relating to the management of the fund. These are mainly incurred in Norges Bank, but management costs are also incurred in subsidiaries of Norges Bank that are exclusively established as part of the management of the GPFG’s investments in unlisted real estate and unlisted renewable energy infrastructure.
Management costs in Norges Bank
The Ministry of Finance reimburses Norges Bank for costs incurred in connection with the management of the GPFG, in the form of a management fee. The management fee is equivalent to the actual costs incurred by Norges Bank, including performance-based fees to external managers, and is expensed in the income statement line Management fee. Costs included in the management fee are specified in table 12.1.
Table 12.1 Management fee
|
Amounts in NOK million |
2023 |
2022 |
||
|---|---|---|---|---|
|
Basis points |
Basis points |
|||
|
Salary, social security and other personnel-related costs |
2 045 |
1 579 |
||
|
Custody costs |
464 |
473 |
||
|
IT services, systems, data and information |
773 |
632 |
||
|
Research, consulting and legal fees |
269 |
247 |
||
|
Other costs |
276 |
274 |
||
|
Allocated costs Norges Bank |
256 |
339 |
||
|
Base fees to external managers |
1 205 |
963 |
||
|
Management fee excluding performance-based fees |
5 289 |
3.6 |
4 508 |
3.8 |
|
Performance-based fees to external managers |
1 343 |
718 |
||
|
Management fee |
6 632 |
4.5 |
5 226 |
4.4 |
Management costs in subsidiaries
Management costs incurred in wholly-owned subsidiaries consist of costs related to the management of the investments in unlisted real estate and unlisted renewable energy infrastructure. These costs are expensed directly in the portfolio result and are not part of the management fee.
Management costs incurred in non-consolidated subsidiaries are presented in the income statement lines Income/expense from unlisted real estate and Income/expense from unlisted infrastructure. Management costs incurred in consolidated subsidiaries are presented in the income statement line Other income/expense. These costs are specified in table 12.2.
Table 12.2 Management costs subsidiaries
|
Amounts in NOK million |
2023 |
2022 |
||
|---|---|---|---|---|
|
Basis points |
Basis points |
|||
|
Salary, social security and other personnel-related costs |
34 |
30 |
||
|
IT services, systems, data and information |
5 |
4 |
||
|
Research, consulting and legal fees |
52 |
38 |
||
|
Other costs |
58 |
42 |
||
|
Total management costs, subsidiaries1 |
148 |
0.1 |
114 |
0.1 |
|
Of which management costs non-consolidated subsidiaries |
89 |
71 |
||
|
Of which management costs consolidated subsidiaries |
59 |
43 |
||
1 For 2023, the amount consists of NOK 141 million related to investments in unlisted real estate and NOK 7 million related to investments in unlisted renewable energy infrastructure. For 2022, NOK 108 million was related to investments in unlisted real estate and NOK 6 million was related to investments in unlisted infrastructure.
Upper limit for reimbursement of management costs
Every year the Ministry of Finance establishes an upper limit for the reimbursement of management costs. Norges Bank is only reimbursed for costs incurred within this limit. Norges Bank is also reimbursed for performance-based fees to external managers. These fees are not measured against the upper limit.
For 2023, total management costs incurred in Norges Bank and its subsidiaries, excluding performance-based fees to external managers, were limited to NOK 6 200 million. In 2022, the limit was NOK 5 600 million.
Total management costs measured against the upper limit amounted to NOK 5 437 million in 2023. This consisted of management costs in Norges Bank, excluding performance-based fees to external managers, of NOK 5 289 million and management costs in subsidiaries of NOK 148 million. Total management costs including performance-based fees to external managers amounted to NOK 6 781 million in 2023.
Costs measured as a share of assets under management
Costs are also measured in basis points, as a share of average assets under management. Average assets under management are calculated based on the market value of the portfolio in Norwegian kroner at the start of each month in the calendar year.
In 2023, management costs incurred in Norges Bank and its subsidiaries, excluding performance-based fees to external managers, corresponded to 3.7 basis points of assets under management. Management costs including performance-based fees to external managers corresponded to 4.6 basis points of assets under management.
Other operating costs in subsidiaries
In addition to the management costs presented in table 12.2, other operating costs are also incurred in subsidiaries related to the ongoing maintenance, operation and development of the investments. These are not costs related to investing in real estate or renewable energy infrastructure but are costs for operating the underlying investments once they are acquired. Therefore, they are not defined as management costs. Other operating costs are expensed directly in the portfolio result and are not part of the management fee. They are also not included in the costs measured against the upper limit.
Other operating costs incurred in non-consolidated subsidiaries are presented in the income statement lines Income/expense from unlisted real estate and Income/expense from unlisted infrastructure. For further information, see table 6.4 in note 6 Unlisted real estate and table 7.4 in note 7 Unlisted renewable energy infrastructure. Other operating costs incurred in consolidated subsidiaries are presented in the income statement line Other income/expense.
Note 13 Secured lending and borrowing
Secured lending and borrowing consists of collateralised (secured) transactions, where the GPFG posts or receives securities or cash to or from a counterparty, with collateral in the form of other securities or cash. These transactions take place under various agreements such as securities lending agreements, repurchase and reverse repurchase agreements and equity swaps in combination with purchases or sales of equities.
The objective of secured lending and borrowing is to provide an incremental return on the GPFG’s holdings of securities and cash. These transactions are also used in connection with liquidity management.
Accounting policy
Income and expense from secured lending and borrowing
Income and expense mainly consist of interest and net fees. These are recognised on a straight-line basis over the term of the agreement and are presented in the income statement as Income/expense from secured lending and Income/expense from secured borrowing.
Table 13.1 Income/expense from secured lending and borrowing
|
Amounts in NOK million |
2023 |
2022 |
|---|---|---|
|
Income/expense from secured lending |
9 922 |
4 845 |
|
Income/expense from secured borrowing |
-13 278 |
-4 792 |
|
Net income/expense from secured lending and borrowing |
-3 356 |
53 |
Accounting policy
Transferred financial assets
Securities transferred to counterparties are not derecognised when the agreement is entered into, as the derecognition criteria are not met. Since the counterparty has the right to sell or pledge the security, the security is considered to be transferred. Transferred securities are therefore presented separately in the balance sheet lines Equities lent and Bonds lent. During the lending period, the underlying securities are accounted for in accordance with accounting policies for the relevant securities.
When an equity is sold in combination with the purchase of an equivalent equity swap, the sold equity is presented in the balance sheet as Equities lent, since the GPFG’s exposure to the equity is virtually unchanged. The equity swap (derivative) is not recognised in the balance sheet, since this would lead to recognition of the same rights twice. When an equity is purchased in combination with the sale of an equivalent equity swap, the GPFG has virtually no exposure to the equity or the derivative and neither the equity nor the derivative are recognised in the balance sheet.
Secured lending
Cash collateral posted to counterparties is derecognised, and a corresponding receivable reflecting the cash amount that will be returned is recognised as a financial asset, Secured lending. This receivable is measured at fair value.
Secured borrowing
Cash collateral received is recognised as Deposits in banks together with a corresponding financial liability, Secured borrowing. This liability is measured at fair value.
Collateral received in the form of securities
Collateral received through secured lending and borrowing transactions in the form of securities, where the GPFG has the right to sell or pledge the security, is not recognised in the balance sheet.
Table 13.2 shows the amount presented as Secured lending, and the associated collateral received in the form of securities.
Table 13.2 Secured lending
|
Amounts in NOK million |
31.12.2023 |
31.12.2022 |
|---|---|---|
|
Secured lending |
728 559 |
462 982 |
|
Total secured lending |
728 559 |
462 982 |
|
Associated collateral in the form of securities (off balance sheet) |
||
|
Equities received as collateral |
273 558 |
169 631 |
|
Bonds received as collateral1 |
486 798 |
303 525 |
|
Total collateral received in the form of securities related to secured lending |
760 356 |
473 157 |
1 At year-end 2023, bonds received as collateral amounting to NOK 2.6 billion were sold. At year-end 2022, no securities received as collateral were sold or re-pledged.
Table 13.3 shows transferred securities with the associated liability presented as Secured borrowing, and collateral received in the form of securities or guarantees.
Table 13.3 Transferred financial assets and secured borrowing
|
Amounts in NOK million |
31.12.2023 |
31.12.2022 |
|---|---|---|
|
Transferred financial assets and secured borrowing |
||
|
Equities lent |
493 949 |
451 799 |
|
Bonds lent |
1 006 711 |
886 555 |
|
Total transferred financial assets |
1 500 660 |
1 338 354 |
|
Associated cash collateral, recognised as liability |
||
|
Secured borrowing |
911 548 |
796 082 |
|
Total secured borrowing |
911 548 |
796 082 |
|
Associated collateral in the form of securities or guarantees (off balance sheet) |
||
|
Equities received as collateral |
264 550 |
226 054 |
|
Bonds received as collateral |
360 945 |
342 978 |
|
Guarantees |
4 544 |
19 953 |
|
Total collateral received in the form of securities or guarantees related to transferred financial assets |
630 039 |
588 985 |
Note 14 Collateral and offsetting
Accounting policy
Cash collateral derivative transactions
Cash collateral posted in connection with derivative transactions is derecognised and a corresponding receivable, reflecting the cash amount that will be returned, is recognised in the balance sheet as Cash collateral posted. Cash collateral received in connection with derivative transactions is recognised in the balance sheet as Deposits in banks, with a corresponding liability Cash collateral received. Both Cash collateral posted and Cash collateral received are measured at fair value.
Offsetting
Financial assets and liabilities are offset and presented net in the balance sheet when there is a legal right to offset and the intention is to settle net or realise the asset and settle the liability simultanously.
Collateral
For various counterparties and transaction types, cash collateral will both be posted to and received from the same counterparty. Therefore, received cash collateral can be netted against posted cash collateral and vice-versa as shown in table 14.1. The balance sheet lines Cash collateral posted and Cash collateral received are related exclusively to derivative transactions. Collateral in the form of cash or securities is also posted and received in connection with secured lending and borrowing transactions. See note 13 Secured lending and borrowing for further information.
Offsetting
Table 14.1 provides an overview of financial assets and liabilities, the effects of legally enforceable netting agreements and related collateral to reduce counterparty risk. The column Assets/Liabilities in the balance sheet subject to netting shows the carrying amounts of financial assets and liabilities that are subject to legally enforceable netting agreements. These amounts are adjusted for the effect of potential netting of financial assets and liabilities recognised in the balance sheet with the same counterparty, together with posted or received cash collateral. This results in a net exposure, which is shown in the column Assets/Liabilities after netting and collateral.
Some netting agreements could potentially not be legally enforceable. Transactions under the relevant contracts are shown in the column Assets/Liabilities not subject to enforceable netting agreements.
In the event of counterparty default, a collective settlement between Norges Bank and the bankruptcy estate could be agreed for certain groups of instruments, irrespective of whether the instruments belong to the GPFG or Norges Bank’s foreign exchange reserves. Such a settlement will be allocated proportionately between these portfolios and is therefore not adjusted for in the table.
Table 14.1 Assets and liabilities subject to netting agreements
|
Amounts in NOK million, 31.12.2023 |
Amounts subject to enforceable master netting agreements |
||||||||
|---|---|---|---|---|---|---|---|---|---|
|
Description |
Gross financial assets recognised in the balance sheet |
Gross financial liabilities offset in the balance sheet |
Net financial assets in the balance sheet |
Assets not subject to enforceable netting agreements1 |
Assets in the balance sheet subject to netting |
Financial liabilities related to same counterparty |
Cash collateral received (recognised as liability) |
Security collateral received (not recognised) |
Assets after netting and collateral |
|
Assets |
|||||||||
|
Secured lending |
728 559 |
- |
728 559 |
277 351 |
451 208 |
- |
231 221 |
219 987 |
- |
|
Cash collateral posted |
19 361 |
- |
19 361 |
- |
19 361 |
13 715 |
- |
- |
5 646 |
|
Financial derivatives |
22 833 |
3 640 |
19 192 |
178 |
19 013 |
17 719 |
27 |
- |
1 267 |
|
Total |
770 753 |
3 640 |
767 112 |
277 529 |
489 582 |
31 434 |
231 248 |
219 987 |
6 913 |
|
Amounts in NOK million, 31.12.2023 |
Amounts subject to enforceable master netting agreements |
||||||||
|---|---|---|---|---|---|---|---|---|---|
|
Description |
Gross financial liabilities recognised in the balance sheet |
Gross financial assets offset in the balance sheet |
Net financial liabilities in the balance sheet |
Liabilities not subject to enforceable netting agreements2 |
Liabilities in the balance sheet subject to netting |
Financial assets related to same counterparty |
Cash collateral posted (recognised as asset) |
Security collateral posted (not derecognised) |
Liabilities after netting and collateral |
|
Liabilities |
|||||||||
|
Secured borrowing |
911 548 |
- |
911 548 |
175 895 |
735 653 |
- |
231 221 |
501 947 |
2 484 |
|
Cash collateral received |
28 754 |
- |
28 754 |
24 771 |
3 983 |
2 859 |
- |
- |
1 123 |
|
Financial derivatives |
36 695 |
3 640 |
33 055 |
29 |
33 027 |
17 719 |
10 497 |
- |
4 810 |
|
Total |
976 997 |
3 640 |
973 357 |
200 695 |
772 663 |
20 578 |
241 718 |
501 947 |
8 417 |
|
Amounts in NOK million, 31.12.2022 |
Amounts subject to enforceable master netting agreements |
||||||||
|---|---|---|---|---|---|---|---|---|---|
|
Description |
Gross financial assets recognised in the balance sheet |
Gross financial liabilities offset in the balance sheet3 |
Net financial assets in the balance sheet |
Assets not subject to enforceable netting agreements1 |
Assets in the balance sheet subject to netting |
Financial liabilities related to same counterparty |
Cash collateral received (recognised as liability) |
Security collateral received (not recognised) |
Assets after netting and collateral |
|
Assets |
|||||||||
|
Secured lending |
462 982 |
- |
462 982 |
137 371 |
325 611 |
- |
151 451 |
174 150 |
10 |
|
Cash collateral posted |
21 601 |
- |
21 601 |
- |
21 601 |
18 699 |
- |
- |
2 901 |
|
Financial derivatives |
21 238 |
740 |
20 498 |
495 |
20 004 |
19 619 |
386 |
- |
- |
|
Total |
505 820 |
740 |
505 080 |
137 866 |
367 215 |
38 318 |
151 837 |
174 150 |
2 912 |
|
Amounts in NOK million, 31.12.2022 |
Amounts subject to enforceable master netting agreements |
||||||||
|---|---|---|---|---|---|---|---|---|---|
|
Description |
Gross financial liabilities recognised in the balance sheet |
Gross financial assets offset in the balance sheet3 |
Net financial liabilities in the balance sheet |
Liabilities not subject to enforceable netting agreements2 |
Liabilities in the balance sheet subject to netting |
Financial assets related to same counterparty |
Cash collateral posted (recognised as asset) |
Security collateral posted (not derecognised) |
Liabilities after netting and collateral |
|
Liabilities |
|||||||||
|
Secured borrowing |
796 082 |
- |
796 082 |
210 665 |
585 417 |
- |
151 451 |
431 960 |
2 006 |
|
Cash collateral received |
14 801 |
- |
14 801 |
- |
14 801 |
11 211 |
- |
- |
3 590 |
|
Financial derivatives |
40 899 |
740 |
40 159 |
34 |
40 124 |
19 619 |
15 170 |
- |
5 335 |
|
Total |
851 782 |
740 |
851 042 |
210 699 |
640 342 |
30 830 |
166 621 |
431 960 |
10 931 |
1 Secured lending includes amounts related to shares purchased in combination with equity swaps. In 2023, this amounted to NOK 250 billion (NOK 104 billion in 2022). See note 13 Secured lending and borrowing for further information.
2 Secured borrowing includes amounts related to shares sold in combination with equity swaps. In 2023, this amounted to NOK 132 billion (NOK 105 billion in 2022). See note 13 Secured lending and borrowing for further information.
3 Gross amounts offset in the balance sheet have been restated due to a reassessment of exchange traded futures contracts and associated cash collateral. Variation margin and exchange traded futures contracts are now recognised gross, but are considered to satisfy the criteria for offsetting in IAS 32 and are therefore presented net in the balance sheet. The change has no impact on the net amounts presented in the balance sheet.
Note 15 Related parties
Accounting policy
Norges Bank is owned by the Norwegian government and is, in line with IAS 24 Related party disclosures, exempt from the disclosure requirements pertaining to related party transactions and outstanding balances, including commitments, with the Norwegian government. This includes transactions with other entities that are related parties because the Norwegian government has control of, joint control of, or significant influence over both Norges Bank and the other entities.
Norges Bank, including the GPFG, is a separate legal entity that is wholly state-owned through the Ministry of Finance. See note 1 General information for information regarding the relationship between the Ministry of Finance, Norges Bank and the GPFG. The GPFG conducts all transactions at market terms.
Transactions with the government
The Ministry of Finance has placed funds for investment in the GPFG in the form of a Norwegian krone deposit with Norges Bank (the krone account). The krone deposit is subsequently placed with Norges Bank Investment Management for investment management. In accordance with the management mandate, transfers are made to and from the krone account. See additional information regarding the inflow/withdrawal for the period in the Statement of changes in owner’s capital.
Transactions with Norges Bank
Norges Bank does not bear any economic risk from the management of the GPFG.
Management fee
The Ministry of Finance reimburses Norges Bank for costs incurred in connection with the management of the GPFG in the form of a management fee. See note 12 Management costs for further information. The management fee is deducted from the krone account throughout the year based on forecasts. The difference between the total amount deducted and the final management fee for the year is presented in the balance sheet as Management fee receivable or Management fee payable and is settled in the following year. In 2023, NOK 6.5 billion was deducted from the krone account to pay the accrued management fee, while NOK 5.0 billion was deducted in 2022. Management fee receivable was NOK 168 million at the end of 2023, compared to a receivable of NOK 274 million at the end of 2022.
Inflows to or withdrawals from the krone account
Inflows to or withdrawals from the krone account are carried out through monthly transfers between the GPFG and Norges Bank. Five percent of the transferred amount is withheld until the following month, in order to adjust the transferred amount in transaction currency to the instructed amount stated in Norwegian kroner from the Ministry of Finance. Unsettled transfer constitutes an outstanding balance between the GPFG and Norges Bank, and is presented in the balance sheet line Other assets or Other liabilities. Unsettled inflow at the end of 2023 presented in Other assets amounted to NOK 2 365 million. At the end of 2022, NOK 1 468 million was presented in Other assets related to unsettled inflow.
Transactions between the GPFG and Norges Bank’s foreign exchange reserves
Internal trades in the form of money market lending or borrowing between the GPFG and Norges Bank’s foreign exchange reserves are presented as a net balance between the two portfolios in the balance sheet lines Other assets and Other liabilities. At the end of 2023, the net balance between the portfolios represented a receivable for the GPFG of NOK 59 million, compared to a receivable of NOK 302 million at the end of 2022. Related income and expense items are presented net in the income statement as Interest income/expense.
Transactions with subsidiaries
Subsidiaries of Norges Bank are established as part of the management of the GPFG’s investments in unlisted real estate and unlisted renewable energy infrastructure. For an overview of the companies that own and manage the investments, as well as consolidated subsidiaries, see note 16 Interests in other entities. For further information regarding transactions with subsidiaries, see note 6 Unlisted real estate and note 7 Unlisted renewable energy infrastructure.
Note 16 Interests in other entities
Investments in unlisted real estate and unlisted renewable energy infrastructure are made through subsidiaries of Norges Bank, exclusively established as part of the management of the GPFG. All subsidiaries are 100 percent owned. These subsidiaries invest, through holding companies, in entities that invest in properties and renewable energy infrastructure. These entities may be subsidiaries or jointly controlled entities.
The overall objective of the ownership structures used for investments in unlisted real estate and unlisted infrastructure is to safeguard the financial wealth under management and to ensure the highest possible net return after costs, in accordance with the management mandate issued by the Ministry of Finance. Key criteria when deciding the ownership structure are legal protection, governance and operational efficiency. Taxes may represent a significant cost for the unlisted investments. Expected tax expense for the fund is therefore one of the factors considered when determining the ownership structure.
Table 16.1 shows the companies that own and manage the properties and infrastructure assets, as well as consolidated subsidiaries.
Table 16.1 Real estate and infrastructure companies
|
Company |
Business address |
Property address1 |
Ownership share and voting right in percent |
Effective ownership share of underlying properties in percent |
Recognised from |
|---|---|---|---|---|---|
|
Non-consolidated companies |
|||||
|
United Kingdom |
|||||
|
NBIM George Partners LP2 |
London |
London |
100.00 |
25.00 |
2011 |
|
MSC Property Intermediate Holdings Limited |
London |
Sheffield |
50.00 |
50.00 |
2012 |
|
NBIM Charlotte Partners LP |
London |
London |
100.00 |
57.75 |
2014 |
|
NBIM Edward Partners LP |
London |
London |
100.00 |
100.00 |
2014 |
|
NBIM Caroline Partners LP |
London |
London |
100.00 |
100.00 |
2015 |
|
NBIM Henry Partners LP |
London |
London |
100.00 |
100.00 |
2016 |
|
NBIM Elizabeth Partners LP |
London |
London |
100.00 |
100.00 |
2016 |
|
NBIM Eleanor Partners LP |
London |
London |
100.00 |
100.00 |
2018 |
|
WOSC Partners LP |
London |
London |
75.00 |
75.00 |
2019 |
|
PELP UK Limited |
Solihull |
Multiple British cities |
50.00 |
50.00 |
2022 |
|
Longfellow Strategic Value UK I LP |
Bristol |
Cambridge |
48.75 |
48.75 |
2022 |
|
Luxembourg |
|||||
|
NBIM S.à r.l. |
Luxembourg |
N/A |
100.00 |
N/A |
2011 |
|
France |
|||||
|
NBIM Louis SAS |
Paris |
Paris |
100.00 |
50.00 |
2011 |
|
SCI 16 Matignon |
Paris |
Paris |
50.00 |
50.00 |
2011 |
|
Champs Elysées Rond-Point SCI |
Paris |
Paris |
50.00 |
50.00 |
2011 |
|
SCI PB 12 |
Paris |
Paris |
50.00 |
50.00 |
2011 |
|
SCI Malesherbes |
Paris |
Paris |
50.00 |
50.00 |
2012 |
|
SCI 15 Scribe |
Paris |
Paris |
50.00 |
50.00 |
2012 |
|
SAS 100 CE |
Paris |
Paris |
50.00 |
50.00 |
2012 |
|
SCI Daumesnil |
Paris |
Paris |
50.00 |
50.00 |
2012 |
|
SCI 9 Messine |
Paris |
Paris |
50.00 |
50.00 |
2012 |
|
SCI Pasquier |
Paris |
Paris |
50.00 |
50.00 |
2013 |
|
NBIM Marcel SCI |
Paris |
Paris |
100.00 |
100.00 |
2014 |
|
NBIM Victor SCI |
Paris |
Paris |
100.00 |
100.00 |
2016 |
|
NBIM Eugene SCI |
Paris |
Paris |
100.00 |
100.00 |
2017 |
|
NBIM Beatrice SCI |
Paris |
Paris |
100.00 |
100.00 |
2018 |
|
NBIM Jeanne SCI |
Paris |
Paris |
100.00 |
100.00 |
2019 |
|
Rodolphe Paris 1 SCI |
Paris |
Paris |
65.00 |
65.00 |
2022 |
|
Germany |
|||||
|
NKE Neues Kranzler Eck Berlin Immobilien GmbH & Co. KG |
Frankfurt |
Berlin |
50.00 |
50.00 |
2012 |
|
NBIM Helmut 2 GmbH & Co KG |
Berlin |
Berlin |
100.00 |
100.00 |
2020 |
|
Sochribel GmbH |
Berlin |
Berlin |
50.00 |
50.00 |
2022 |
|
Rodolphe Berlin 1 GmbH |
Berlin |
Berlin |
65.00 |
65.00 |
2023 |
|
He Dreith Investor GmbH |
Karlsruhe |
He Dreiht |
33.33 |
16.63 |
2023 |
|
Switzerland |
|||||
|
NBIM Antoine CHF S.à r.l. |
Luxembourg |
Zürich |
100.00 |
100.00 |
2012 |
|
Europe |
|||||
|
Prologis European Logistics Partners S.à r.l. |
Luxembourg |
Multiple European cities |
50.00 |
50.00 |
2013 |
|
United States |
|||||
|
T-C 1101 Pennsylvania Venture LLC |
Wilmington, DE |
Washington |
49.90 |
49.90 |
2013 |
|
T-C Franklin Square Venture LLC |
Wilmington, DE |
Washington |
49.90 |
49.90 |
2013 |
|
T-C 33 Arch Street Venture LLC |
Wilmington, DE |
Boston |
49.90 |
49.90 |
2013 |
|
No. 1 Times Square Development LLC |
Wilmington, DE |
New York |
45.00 |
45.00 |
2013 |
|
OFC Boston LLC |
Wilmington, DE |
Boston |
47.50 |
47.50 |
2013 |
|
425 MKT LLC |
Wilmington, DE |
San Francisco |
47.50 |
47.50 |
2013 |
|
555 12th LLC |
Wilmington, DE |
Washington |
47.50 |
47.50 |
2013 |
|
Prologis U.S. Logistics Venture LLC |
Wilmington, DE |
Multiple American cities |
46.30 |
44.96 |
2014 |
|
OBS Boston LLC |
Wilmington, DE |
Boston |
47.50 |
47.50 |
2014 |
|
100 Federal JV LLC |
Wilmington, DE |
Boston |
45.00 |
45.00 |
2014 |
|
Atlantic Wharf JV LLC |
Wilmington, DE |
Boston |
45.00 |
45.00 |
2014 |
|
BP/CG Center MM LLC |
Wilmington, DE |
New York |
45.00 |
45.00 |
2014 |
|
T-C 2 Herald Square Venture LLC |
Wilmington, DE |
New York |
49.90 |
49.90 |
2014 |
|
T-C 800 17th Street Venture NW LLC |
Wilmington, DE |
Washington |
49.90 |
49.90 |
2014 |
|
T-C Foundry Sq II Venture LLC |
Wilmington, DE |
San Francisco |
49.90 |
49.90 |
2014 |
|
T-C Hall of States Venture LLC |
Wilmington, DE |
Washington |
49.90 |
49.90 |
2014 |
|
SJP TS JV LLC |
Wilmington, DE |
New York |
45.00 |
45.00 |
2015 |
|
T-C Republic Square Venture LLC |
Wilmington, DE |
Washington |
49.90 |
49.90 |
2015 |
|
T-C 888 Brannan Venture LLC |
Wilmington, DE |
San Francisco |
49.90 |
49.90 |
2015 |
|
Hudson Square Properties, LLC |
Wilmington, DE |
New York |
48.00 |
48.00 |
2015 |
|
ConSquare LLC |
Wilmington, DE |
Washington |
47.50 |
47.50 |
2016 |
|
100 First Street Member LLC |
Wilmington, DE |
San Francisco |
44.00 |
44.00 |
2016 |
|
303 Second Street Member LLC |
Wilmington, DE |
San Francisco |
44.00 |
44.00 |
2016 |
|
900 16th Street Economic Joint Venture (DE) LP |
Wilmington, DE |
Washington |
49.00 |
49.00 |
2017 |
|
1101 NYA Economic Joint Venture (DE) LP |
Wilmington, DE |
Washington |
49.00 |
49.00 |
2017 |
|
375 HSP LLC |
Wilmington, DE |
New York |
48.00 |
48.00 |
2017 |
|
T-C 501 Boylston Venture LLC |
Wilmington, DE |
Boston |
49.90 |
49.90 |
2018 |
|
SVF Seaport JV LLC |
Wilmington, DE |
Boston |
45.00 |
45.00 |
2018 |
|
OMD Venture LLC |
Wilmington, DE |
Boston |
47.50 |
47.50 |
2021 |
|
ARE-MA Region No. 102 JV LLC |
Wilmington, DE |
Boston |
41.00 |
41.00 |
2021 |
|
JV 347 Madison LLC |
Wilmington, DE |
New York |
45.00 |
45.00 |
2023 |
|
300 Binney JV LLC |
Wilmington, DE |
Boston |
45.00 |
45.00 |
2023 |
|
Japan |
|||||
|
TMK Tokyo TN1 |
Tokyo |
Tokyo |
70.00 |
70.00 |
2017 |
|
Tokyo MN1 TMK |
Tokyo |
Tokyo |
100.00 |
39.90 |
2020 |
|
Netherlands |
|||||
|
Borssele Wind Farm C.V. |
The Hague |
Borssele 1&2 |
50.00 |
50.00 |
2021 |
|
Spain |
|||||
|
Energías Renovables Romeo, S.L |
Madrid |
Multiple locations |
49.00 |
49.00 |
2023 |
|
Consolidated subsidiaries |
|||||
|
Japan |
|||||
|
NBRE Management Japan Advisors K.K. |
Tokyo |
N/A |
100.00 |
N/A |
2015 |
|
United Kingdom |
|||||
|
NBRE Management Europe Limited |
London |
N/A |
100.00 |
N/A |
2016 |
1 For investments in unlisted real estate, the property address is shown. For investments in unlisted infrastructure, the project name is shown.
2 One property in this company, 20 Air Street, has an ownership share of 50 percent.
Activity in the consolidated subsidiaries consists of providing investment-related services to the GPFG. This activity is presented in the income statement line Other costs and included in the balance sheet lines Other assets and Other liabilities.
In addition to the companies shown in table 16.1, Norges Bank has wholly-owned holding companies established in connection with investments in unlisted real estate and unlisted renewable energy infrastructure. These holding companies do not engage in any operations and do not own any properties or infrastructure assets directly. The holding companies have their business address either in the same country as the investments, in connection with NBIM S.à r.l. in Luxembourg, or in Norway for the holding companies established for investments in Japan and continental Europe.
Note 17 Other assets and other liabilities
Table 17.1 Other assets
|
Amounts in NOK million |
31.12.2023 |
31.12.2022 |
|---|---|---|
|
Net balance Norges Bank's foreign exchange reserves1 |
59 |
302 |
|
Unsettled inflow krone account1 |
2 365 |
1 468 |
|
Accrued income from secured lending |
245 |
227 |
|
Other |
83 |
20 |
|
Other assets |
2 752 |
2 017 |
1 See note 15 Related parties for further information.
Table 17.2 Other liabilities
|
Amounts in NOK million |
31.12.2023 |
31.12.2022 |
|---|---|---|
|
Tax payable |
15 |
12 |
|
Other |
97 |
44 |
|
Other liabilities |
112 |
56 |
Independent auditor’s report
To the Supervisory Council of Norges Bank
Opinion
We have audited the financial statements for the investment portfolio of the Government Pension Fund Global which are included in Norges Bank’s annual financial statements. The financial statements comprise the balance sheet as at 31 December 2023, the income statement, statement of changes in owner’s capital and statement of cash flows for the year then ended, and notes to the financial statements, including a summary of significant accounting policies.
In our opinion, the financial statements comply with applicable legal requirements and give a true and fair view of the financial position of the investment portfolio of the Government Pension Fund Global as at 31 December 2023 and its financial performance and cash flows for the year then ended in accordance with IFRS Accounting Standards as adopted by the EU.
Basis for opinion
We conducted our audit in accordance with International Standards on Auditing (ISAs). Our responsibilities under those standards are further described in the Auditor’s responsibilities for the audit of the financial statements section of our report. We are independent of Norges Bank in accordance with the requirements of the relevant laws and regulations in Norway and the International Ethics Standards Board for Accountants’ International Code of Ethics for Professional Accountants (including International Independence Standards) (IESBA Code), and we have fulfilled our other ethical responsibilities in accordance with these requirements. We believe that the audit evidence we have obtained is sufficient and appropriate to provide a basis for our opinion.
Key audit matters
Key audit matters are those matters that, in our professional judgment, were of most significance in our audit of the financial statements for 2023. These matters were addressed in the context of our audit of the financial statements as a whole, and in forming our opinion thereon, and we do not provide a separate opinion on these matters. For each matter below, our description of how our audit addressed the matter is provided in that context.
We have fulfilled the responsibilities described in the Auditor’s responsibilities for the audit of the financial statements section of our report, including in relation to these matters. Accordingly, our audit included the performance of procedures designed to respond to our assessment of the risks of material misstatement of the financial statements. The results of our audit procedures, including the procedures performed to address the matters below, provide the basis for our audit opinion on the financial statements.
Basis for the key audit matter
Listed investments measured at fair value are measured at market value if the investments are traded in what is assessed to be an active market. These investments are classified as level 1 assets in the fair value hierarchy. Listed investments valued based on models which use directly or indirectly observable market data are classified as level 2 assets. Investments classified in level 1 and 2 of the fair value hierarchy as at 31 December amount to NOK 15 444 244 million.
Investments valued based on models which mainly use inputs that are not observable in the market place, are classified as level 3 assets in the fair value hierarchy. These valuations are to a larger extent influenced by judgmental assessments and therefore have a higher inherent risk of misstatement. As of 31 December, these assets amount to NOK 320 554 million.
Investments measured at fair value constitute the most material share of assets as at 31 December. The material amount, the measurement at fair value with occasional use of judgments and the classification to levels 1, 2 or 3 respectively in the fair value hierarchy, and the fact that the return on investment measurement follows from these valuations, we have considered the valuation of these investments to be a key audit matter.
The investments measured at fair value are disclosed in note 8 and 3 in the financial statements
Our audit response
For both listed and unlisted investments, we assessed the design and tested the operating effectiveness of internal controls over valuation processes, including controls over management’s determination and approval of the methodology and assumptions used for valuation. For listed investments, we furthermore compared the recognized value at the balance sheet date, with externally observable market prices.
Our audit procedures for unlisted level 3 investments also comprised management’s use of external experts and valuations, including the experts’ expertise and objectivity. We have used EY’s internal valuation specialists to review assumptions and calculations of valuation reports on a sample basis.
We have furthermore evaluated the design and tested the operating effectiveness of internal controls over the classification in the fair value hierarchy. For a sample of investments, we have tested the detailed classification in levels 1, 2 and 3 in the fair value hierarchy.
IT systems that support financial reporting
Basis for the key audit matter
Norges Bank has a complex and automated IT environment and is dependent on IT processes for reporting financial information. To ensure complete and accurate processing and reporting of financial information, it is important that controls over access management and system changes are designed and operate effectively. Key IT processes are also dependent on a well-functioning control environment at external service providers. IT systems that support financial reporting are considered to be a key audit matter as the IT environment is important to ensure accuracy, completeness and reliable financial reporting.
Our audit response
We obtained an understanding of Norges Bank’s IT systems, IT environment and controls of importance to the financial reporting. We tested IT general controls over access management, system changes and IT operations. Further, we tested automated controls in the IT environment supporting financial reporting.
For relevant IT systems managed by external service providers, we evaluated third-party systems and organizations controls reports (ISAE 3402 reports) for the service provider’s control environment. We further assessed the design and tested the operating effectiveness of Norges Bank’s own controls relating to outsourced services. We have used our own IT specialists in our work to understand the organization’s IT environment as well as in assessing the design of control activities and conducting the testing of the operating effectiveness of controls.
Other information
Other information consists of the information included in the annual report other than the financial statements and our auditor’s report thereon. The Executive Board and management (management) is responsible for the other information. Our opinion on the financial statements does not cover the other information, and we do not express any form of assurance conclusion thereon.
In connection with our audit of the financial statements, our responsibility is to read the other information, and, in doing so, consider whether the other information is materially inconsistent with the financial statements or our knowledge obtained in the audit, or otherwise appears to be materially misstated. If, based on the work we have performed, we conclude that there is a material misstatement of this other information, we are required to report that fact. We have nothing to report in this regard.
Responsibilities of management for the financial statements
Management is responsible for the preparation and fair presentation of the financial statements in accordance with IFRS Accounting Standards as adopted by the EU and for such internal control as management determines is necessary to enable the preparation of financial statements that are free from material misstatement, whether due to fraud or error.
In preparing the financial statements, management is responsible for assessing Norges Bank’s ability to continue as a going concern, disclosing, as applicable, matters related to going concern and using the going concern basis of accounting unless management either intends to liquidate Norges Bank or to cease operations, or has no realistic alternative but to do so.
Auditor’s responsibilities for the audit of the financial statements
Our objectives are to obtain reasonable assurance about whether the financial statements as a whole are free from material misstatement, whether due to fraud or error, and to issue an auditor’s report that includes our opinion. Reasonable assurance is a high level of assurance, but is not a guarantee that an audit conducted in accordance with ISAs will always detect a material misstatement when it exists. Misstatements can arise from fraud or error and are considered material if, individually or in the aggregate, they could reasonably be expected to influence the economic decisions of users taken on the basis of these financial statements.
As part of an audit in accordance with ISAs, we exercise professional judgment and maintain professional scepticism throughout the audit. We also:
- Identify and assess the risks of material misstatement of the financial statements, whether due to fraud or error, design and perform audit procedures responsive to those risks, and obtain audit evidence that is sufficient and appropriate to provide a basis for our opinion. The risk of not detecting a material misstatement resulting from fraud is higher than for one resulting from error, as fraud may involve collusion, forgery, intentional omissions, misrepresentations, or the override of internal control.
- Obtain an understanding of internal control relevant to the audit in order to design audit procedures that are appropriate in the circumstances, but not for the purpose of expressing an opinion on the effectiveness of Norges Bank’s internal control.
- Evaluate the appropriateness of accounting policies used and the reasonableness of accounting estimates and related disclosures made by management.
- Conclude on the appropriateness of management’s use of the going concern basis of accounting and, based on the audit evidence obtained, whether a material uncertainty exists related to events or conditions that may cast significant doubt on Norges Bank’s ability to continue as a going concern. If we conclude that a material uncertainty exists, we are required to draw attention in our auditor’s report to the related disclosures in the financial statements or, if such disclosures are inadequate, to modify our opinion. Our conclusions are based on the audit evidence obtained up to the date of our auditor’s report. However, future events or conditions may cause Norges Bank to cease to continue as a going concern.
- Evaluate the overall presentation, structure and content of the financial statements, including the disclosures, and whether the financial statements represent the underlying transactions and events in a manner that achieves fair presentation.
We communicate with the Executive Board regarding, among other matters, the planned scope and timing of the audit and significant audit findings, including any significant deficiencies in internal control that we identify during our audit.
From the matters communicated with the Executive Board, we determine those matters that were of most significance in the audit of the financial statements of the current period and are therefore the ke y audit matters. We describe these matters in our auditor’s report unless law or regulation precludes public disclosure about the matter or when, in extremely rare circumstances, we determine that a matter should not be communicated in our report because the adverse consequences of doing so would reasonably be expected to outweigh the public interest benefits of such communication.
Oslo, 8 February 2024
ERNST & YOUNG AS
Kjetil Rimstad
statsautorisert revisor
(This translation from Norwegian has been prepared for information purposes only.)