The investments

The investments in the Government Pension Fund Global returned 9.4 percent in the first half of 2026. This was 0.22 percentage point higher than the return on the benchmark index. The fund’s value was 22,683 billion kroner at the end of the half-year, an increase of 1,416 billion kroner during the period.
Of the change in the fund’s value in the first half of 2026, the accounting return amounted to 1,753 billion kroner. The fund received inflows of 89 billion kroner after deduction of costs, while a stronger krone reduced the value by -427 billion kroner.
Equity investments accounted for 72.1 percent of the fund’s value at the end of the first half of 2026, and fixed-income investments 25.8 percent. Unlisted real estate accounted for 1.6 percent and unlisted renewable energy infrastructure 0.5 percent.
An overview of all of the fund’s investments is available at www.nbim.no.
The return is primarily measured in international currency, which is a weighted combination of the currencies in the benchmark indices for equities and bonds. This combination is referred to as the fund’s currency basket. Unless otherwise stated, the results in this report are measured in the fund’s currency basket.
TABLE 1 Key figures in billions of kroner.
|
First half 2026 |
First quarter 2026 |
2025 |
|
|---|---|---|---|
|
Market value |
|||
|
Equity investments |
16,358 |
14,036 |
15,173 |
|
Fixed-income investments |
5,860 |
5,522 |
5,649 |
|
Unlisted real estate investments |
373 |
359 |
372 |
|
Unlisted infrastructure investments |
104 |
88 |
91 |
|
Market value of investment portfolio1 |
22,695 |
20,004 |
21,286 |
|
Deferred tax |
-7 |
-3 |
-11 |
|
Accrued, not paid, management fees2 |
-5 |
-2 |
-8 |
|
Fund value1 |
22,683 |
19,998 |
21,268 |
|
Inflow of capital |
94 |
15 |
327 |
|
Withdrawal of capital |
0 |
0 |
0 |
|
Paid management fees3 |
-8 |
-8 |
0 |
|
Return on fund4 |
1,753 |
-636 |
2,362 |
|
Changes due to fluctuations in krone5 |
-427 |
-646 |
-1,155 |
|
Changes due to accrued, not paid, management fees |
3 |
5 |
-7 |
|
Total change in fund value |
1,416 |
-1,270 |
1,526 |
|
Changes in value since first capital inflow in 1996 |
|||
|
Total inflow of capital |
6,285 |
6,206 |
6,191 |
|
Total withdrawal of capital2 |
-687 |
-687 |
-687 |
|
Return on equity investments4 |
13,577 |
11,260 |
11,889 |
|
Return on fixed-income investments4 |
1,543 |
1,475 |
1,494 |
|
Return on unlisted real estate investments4 |
87 |
81 |
76 |
|
Return on unlisted infrastructure investments4 |
11 |
9 |
10 |
|
Management fees3 |
-90 |
-87 |
-85 |
|
Accumulated fluctuations in krone |
1,965 |
1,745 |
2,391 |
|
Accumulated deferred tax6 |
-8 |
-5 |
-12 |
|
Fund value |
22,683 |
19,998 |
21,268 |
|
Return on fund |
15,210 |
12,821 |
13,457 |
|
Return after management costs |
15,120 |
12,734 |
13,372 |
1 The market value of the investment portfolio is presented before management fee payable/receivable and deferred tax.
2 Total inflows and withdrawals of capital are presented in the table adjusted for accrued, not paid, management fee.
3 Management fees are described in note 11 in the financial statements.
4 The fund’s return of 1,753 billion kroner includes the accounting effect of changes in recognised deferred tax. The return on the investment portfolio excludes deferred tax and amounted to 1,750 billion kroner.
5 See note 10 Foreign exchange gains and losses in the financial statements.
6 Does not include the effect of fluctuations in the krone rate on deferred tax.
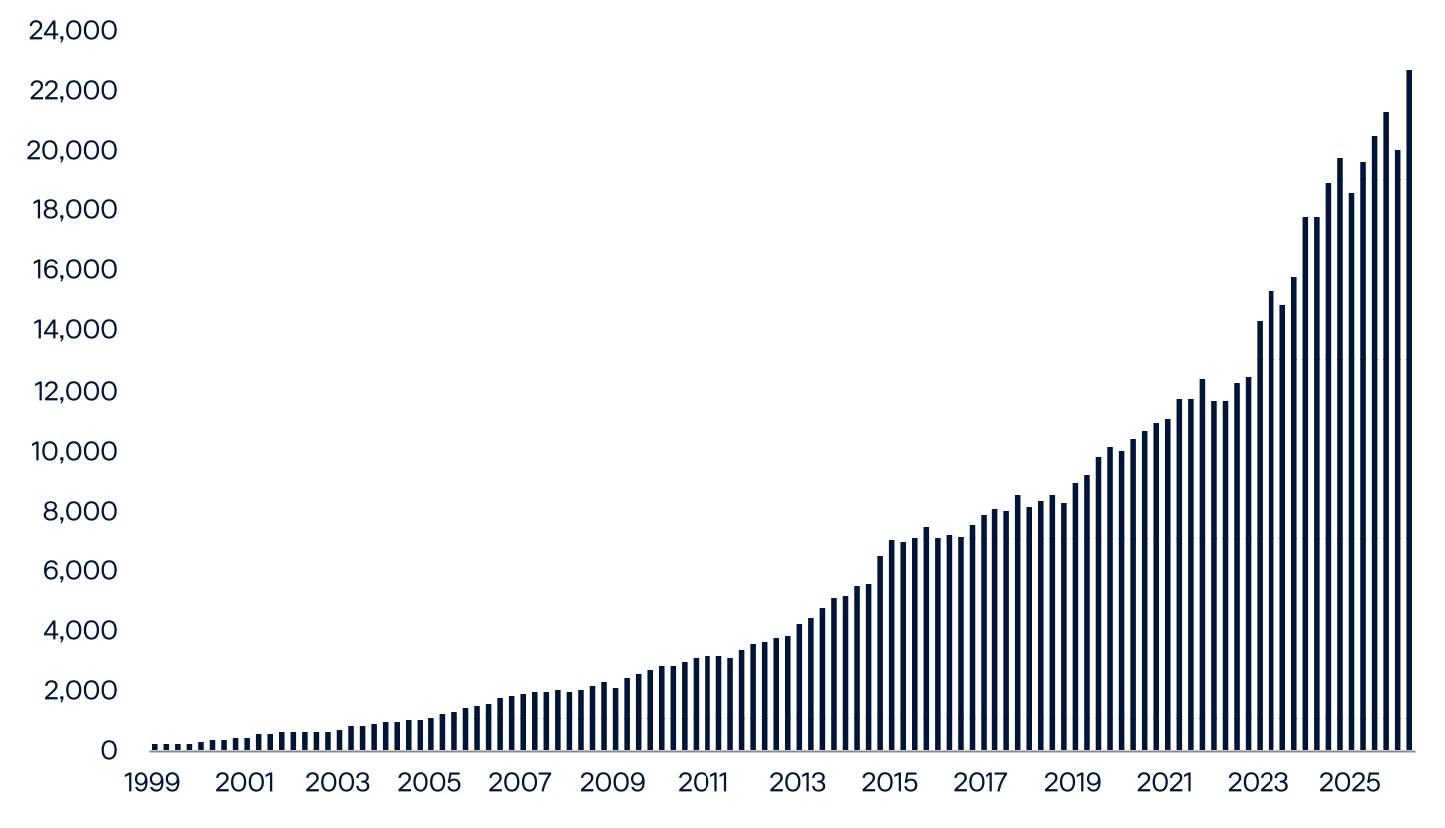
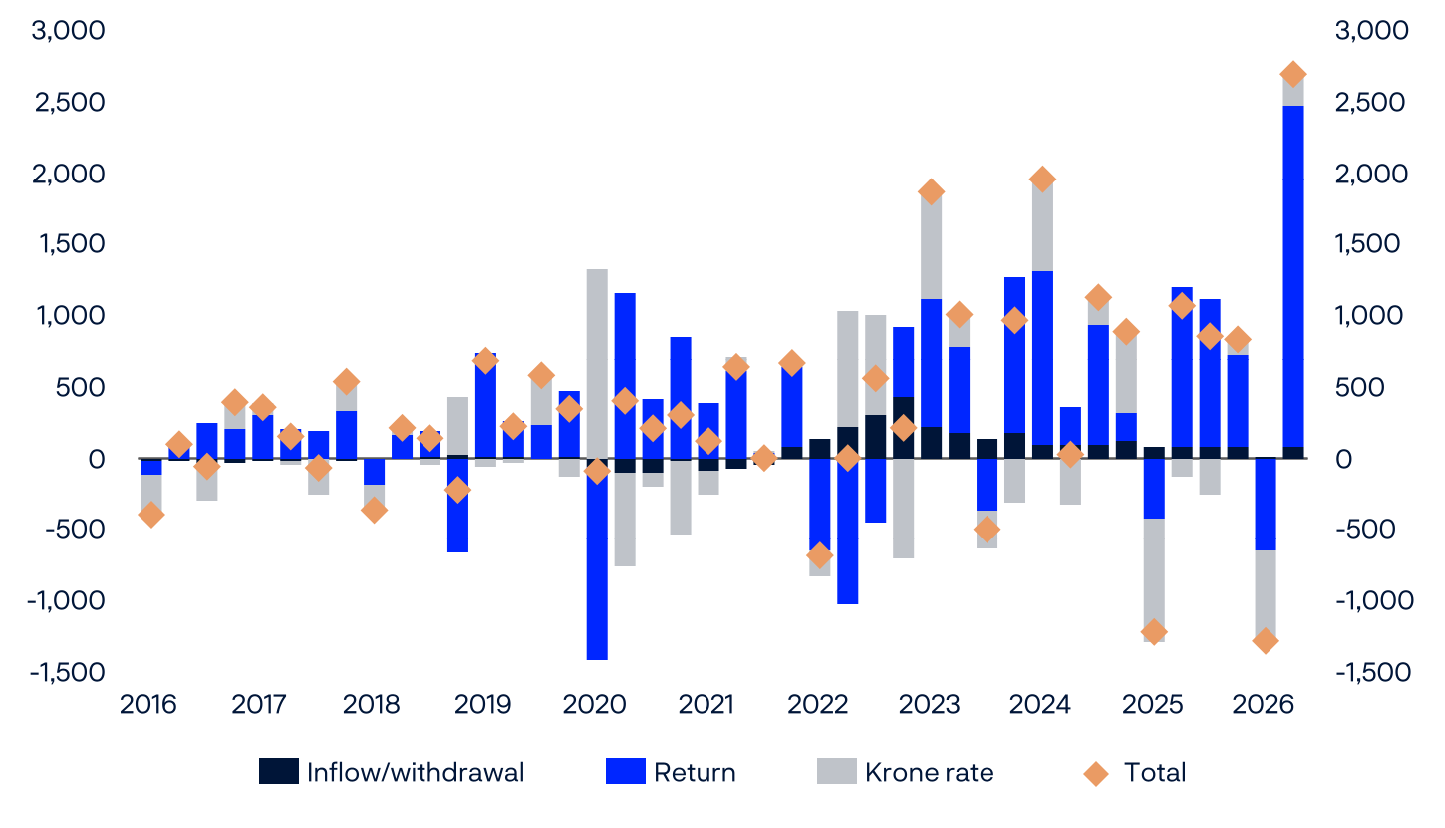
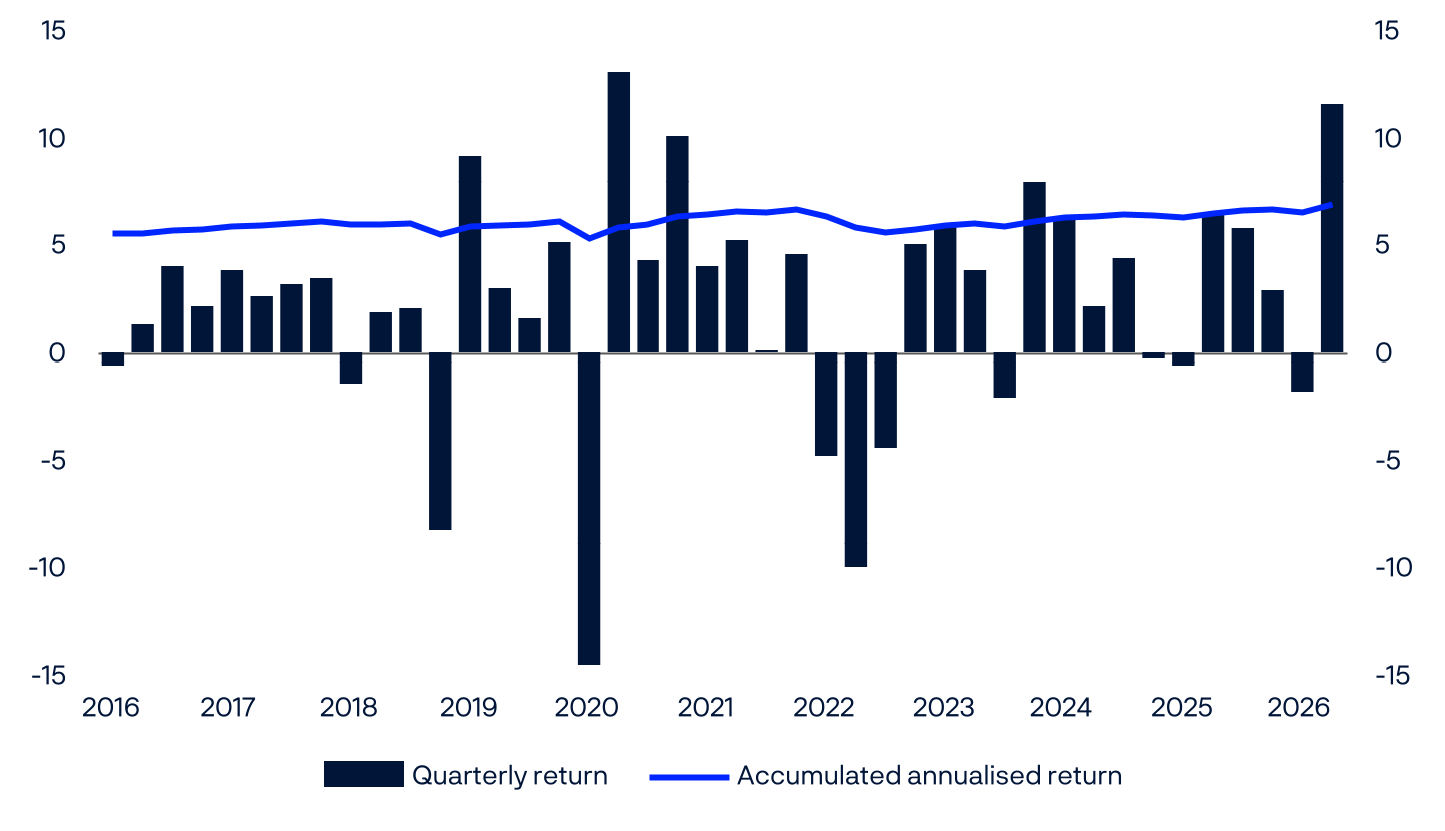
TABLE 2 Return figures in percent. Measured in the fund’s currency basket.
|
First half 2026 |
Second quarter 2026 |
First quarter 2026 |
|
|---|---|---|---|
|
Equity investments |
12.95 |
15.98 |
-2.61 |
|
Fixed-income investments |
0.88 |
1.11 |
-0.23 |
|
Unlisted real estate investments |
3.01 |
1.81 |
1.17 |
|
Unlisted infrastructure investments |
-0.19 |
1.77 |
-1.93 |
|
Return on fund |
9.44 |
11.54 |
-1.89 |
|
Management costs |
0.02 |
0.01 |
0.01 |
|
Return on fund after management costs |
9.42 |
11.53 |
-1.90 |
TABLE 3 Historical key figures in percent as at 30 June 2026. Annualised data, measured in the fund’s currency basket.
|
Since 01.01.1998 |
Last 10 years |
Last 12 months |
|
|---|---|---|---|
|
Return on fund |
6.86 |
9.39 |
19.14 |
|
Annual price inflation |
2.18 |
2.92 |
3.06 |
|
Annual management costs |
0.07 |
0.05 |
0.04 |
|
Net real return on fund |
4.51 |
6.24 |
15.56 |
|
The fund's actual standard deviation |
8.44 |
9.87 |
9.80 |
Return by asset class
The fund’s equity investments returned 13.0 percent in the first half of 2026. Telecommunications, technology and energy delivered the strongest returns. Consumer discretionary companies delivered the weakest returns.Fixed-income investments returned 0.9 percent in the first half of 2026. Government bonds returned 0.5 percent. The fund’s three largest government bond holdings were issued by the US, Japan and Germany.
The fund’s real estate investments returned 5.9 percent in the first half of 2026. The real estate strategy comprises both listed and unlisted investments. Investments in listed real estate returned 9.8 percent. Unlisted real estate investments returned 3.0 percent and accounted for 60 percent of the real estate portfolio. The return on the unlisted investments was mainly driven by stable rental income, supplemented by a moderate increase in property values. US office and logistics properties contributed most to the increases in value within unlisted real estate.
Investments in unlisted renewable energy infrastructure returned -0.2 percent in the first half of 2026. Ongoing income from power sales contributed positively, while currency effects contributed negatively to the return in the first half.
The Ministry of Finance and the Executive Board of Norges Bank have set limits for how much the fund’s investments can deviate from the benchmark index. Information on risk and exposure for each asset class is available at www.nbim.no.
TABLE 4 Return on the fund’s equity investments in the first half of 2026. In percent. Measured in the fund’s currency basket.
|
Market |
Return |
Share of equity investments1 |
|---|---|---|
|
North America |
10.8 |
57.0 |
|
Europe |
8.4 |
20.1 |
|
Asia and Oceania |
31.3 |
12.9 |
|
Emerging markets |
12.6 |
10.5 |
1 Does not sum to 100 percent because cash and derivatives are not included.
TABLE 5 Return on the fund’s equity investments in the first half of 2026. In percent. Measured in the fund’s currency basket and sorted by sector.
|
Sector |
Return |
Share of equity investments1 |
|---|---|---|
|
Technology |
25.3 |
32.2 |
|
Financials |
7.0 |
15.8 |
|
Consumer discretionary |
-4.0 |
11.3 |
|
Industrials |
12.3 |
12.9 |
|
Health care |
3.4 |
8.4 |
|
Real estate |
7.6 |
3.7 |
|
Consumer staples |
5.0 |
3.6 |
|
Basic materials |
10.5 |
3.5 |
|
Telecommunications |
42.9 |
3.8 |
|
Energy |
17.1 |
2.9 |
|
Utilities |
9.8 |
2.4 |
1 Does not sum to 100 percent because cash and derivatives are not included.
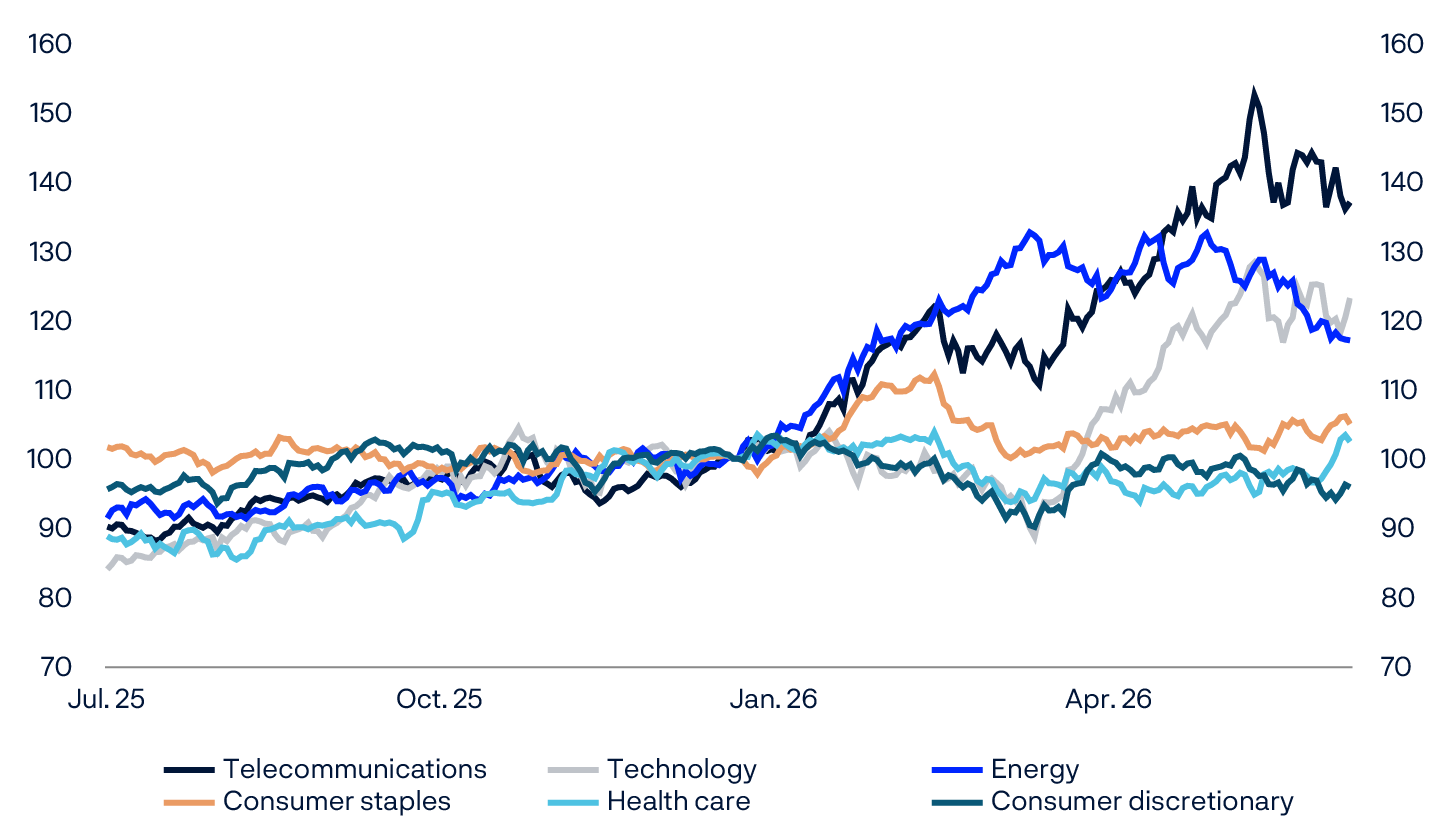
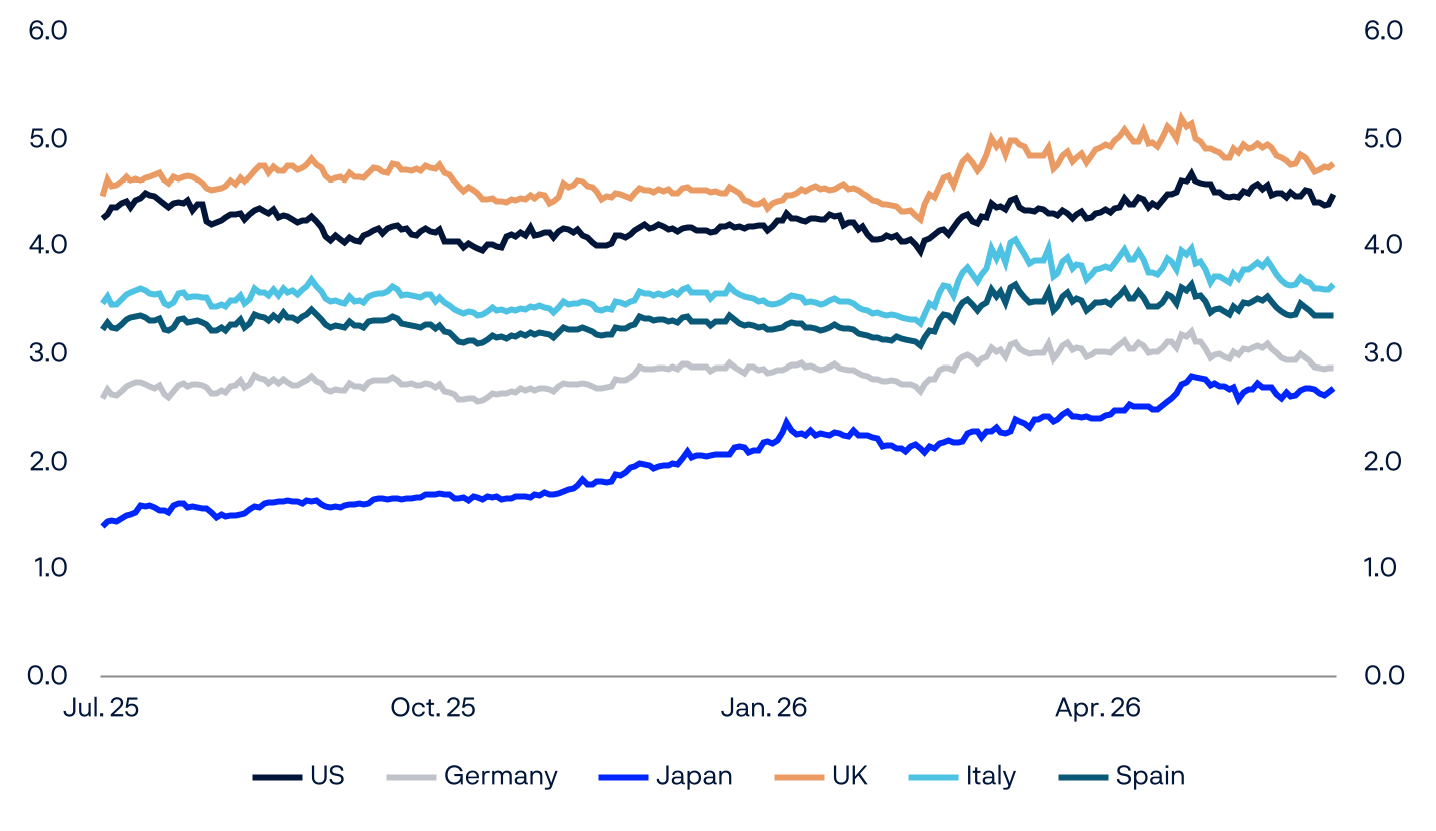
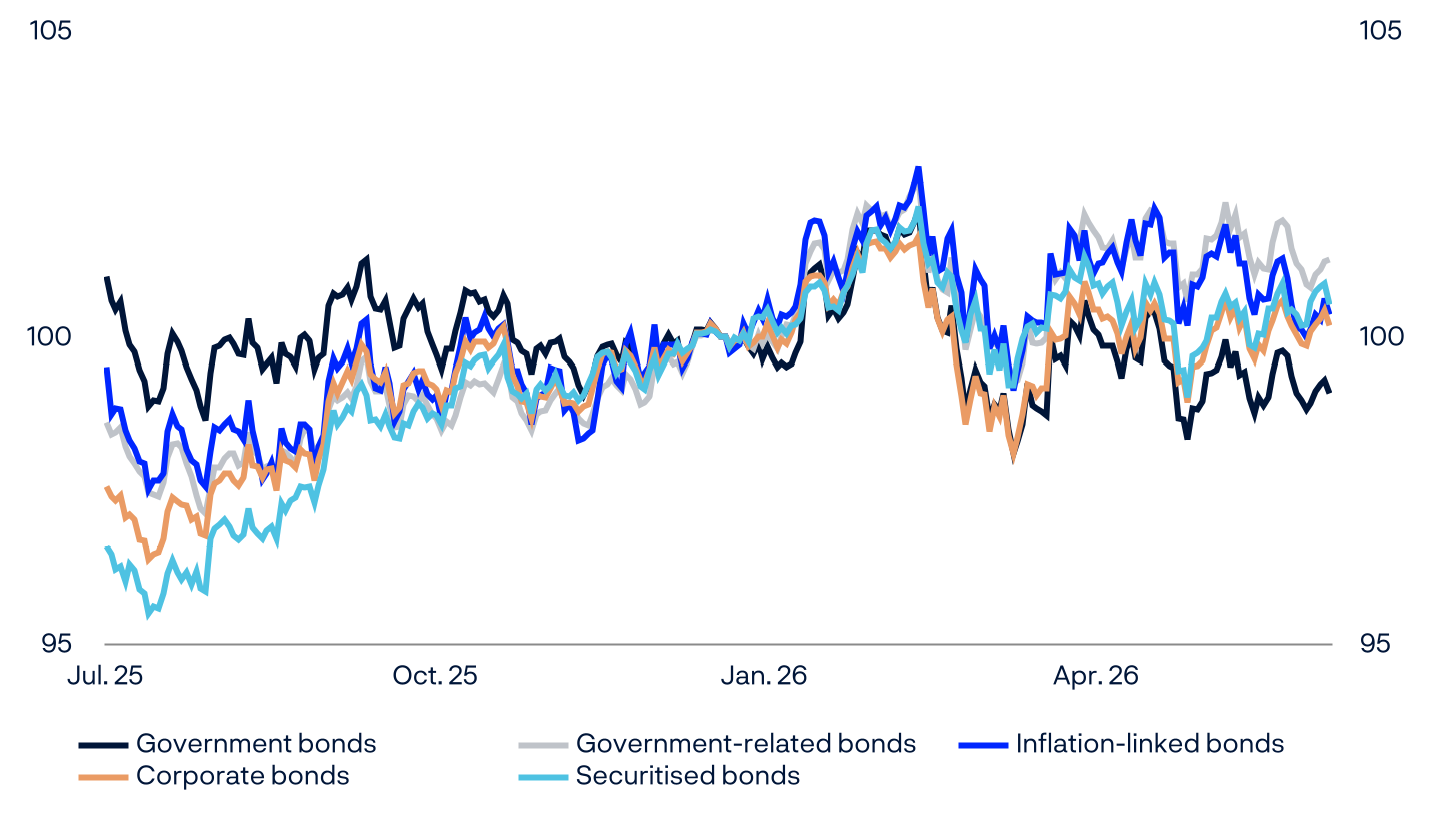
TABLE 6 Return on the fund’s fixed-income investments in the first half of 2026. In percent. Measured in the fund’s currency basket and sorted by sector.
|
Sector |
Return |
Share of fixed-income investments1 |
|---|---|---|
|
Government bonds2 |
0.5 |
54.9 |
|
Government-related bonds2 |
1.7 |
10.4 |
|
Inflation-linked bonds2 |
2.1 |
6.4 |
|
Corporate bonds |
1.3 |
26.3 |
|
Securitised bonds |
-0.5 |
5.9 |
1 Does not sum to 100 percent because cash and derivatives are not included.
2 Governments may issue different types of bonds, and the fund’s investments in these bonds are grouped accordingly. Bonds issued by a country’s government in the country’s own currency are categorised as government bonds. Bonds issued by a country’s government in another country’s currency are government-related bonds. Inflation-linked bonds issued by governments are grouped with inflation-linked bonds.
TABLE 7 Value of real estate investments in millions of kroner as at 30 June 2026.
|
Value1 |
|
|---|---|
|
Unlisted real estate investments |
372,805 |
|
Listed real estate investments |
249,874 |
|
Total real estate investments |
622,679 |
1 Including bank deposits and other receivables.
TABLE 8 Return on unlisted real estate investments in the first half of 2026. In percentage points.
|
Return |
|
|---|---|
|
Rental income |
2.2 |
|
Changes in value |
0.9 |
|
Transaction costs |
0.0 |
|
Result of currency adjustments |
-0.1 |
|
Total |
3.0 |
TABLE 9 Investments in unlisted renewable energy infrastructure as at 30 June 2026.
|
Value |
|
|---|---|
|
Market value (millions of kroner)1 |
104,445 |
|
Return (percent) |
-0.2 |
1 Including bank deposits and other receivables.
Relative return on the fund
The fund’s relative return in the first half of 2026 was 0.22 percentage points higher than the return on the benchmark index from the Ministry of Finance. This corresponds to 45 billion kroner.
Equity management contributed 0.23 percentage points to the relative return in the first half of 2026. Investments in technology and telecommunications made the largest positive contribution, while the consumer discretionary sector made the largest negative contribution.
Fixed-income management contributed 0.05 percentage points to the relative return in the first half of 2026. All regions within fixed-income management contributed positively to the relative return.
Real estate investments contributed 0.08 percentage points to the relative return in the first half of 2026, measured against the equities and bonds that were sold to finance them. Listed real estate investments contributed 0.06 percentage points, while unlisted real estate investments contributed 0.02 percentage points. The relative return on the unlisted real estate investments was driven primarily by investments in the office and logistics sectors in the US.
Investments in renewable energy infrastructure made a marginally negative contribution to the relative return in the first half of 2026.
The relative return in the first half of 2026 was also affected by the fund having a lower share of equities and a higher share of bonds than the benchmark index. This allocation contributed -0.14 percentage points. Other allocation positions reported within equity and fixed-income management contributed 0.10 percentage points.
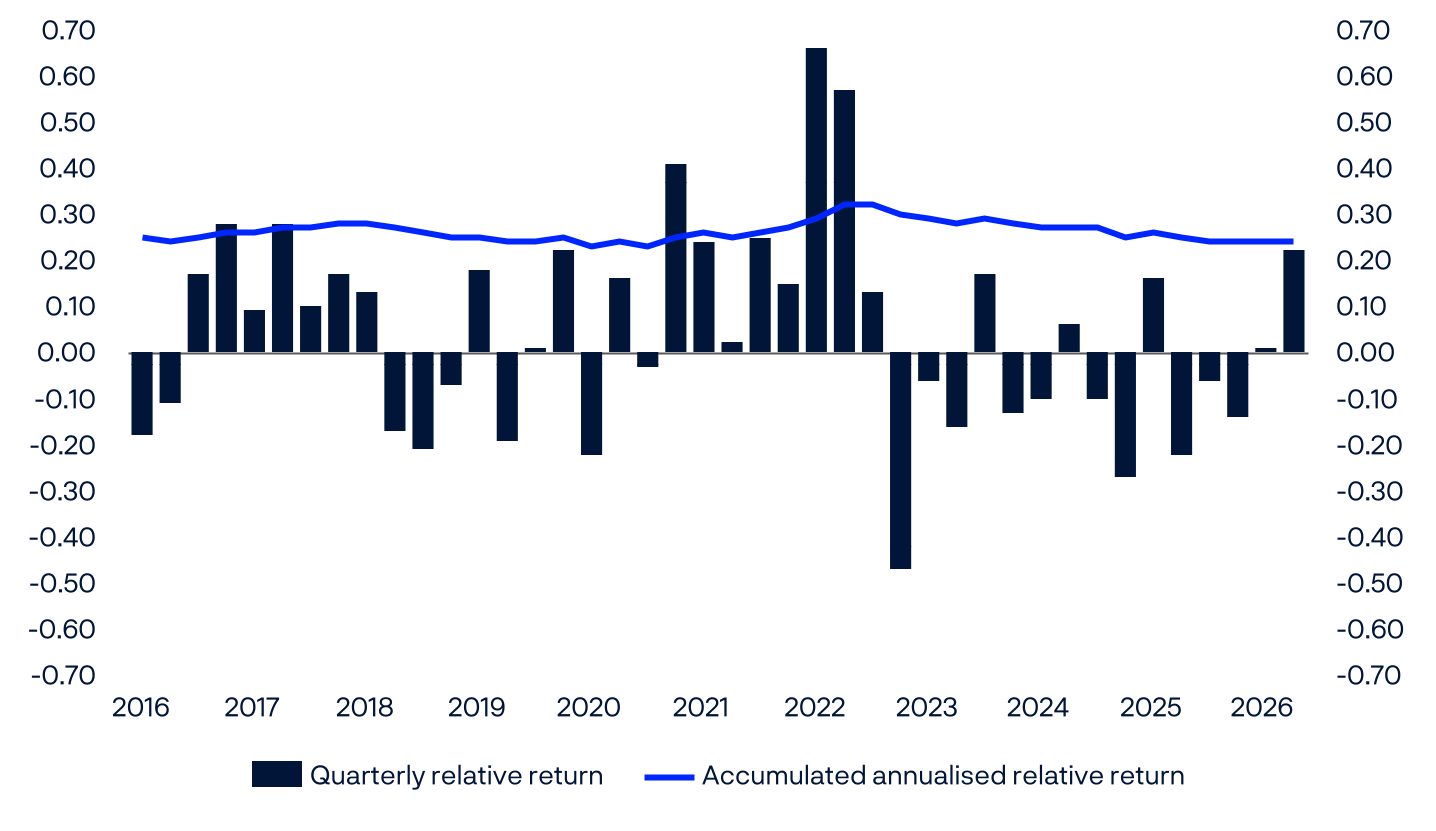
TABLE 10 Historic relative return in percentage points as at 30 June 2026. Annualised figures measured in the fund’s currency basket.
|
Since 01.01.1998 |
Last 15 years |
Last 10 years |
Last 5 years |
Last 12 months |
|
|---|---|---|---|---|---|
|
Relative return on fund (percentage points)1 |
0.24 |
0.17 |
0.24 |
0.18 |
0.01 |
|
The fund's tracking error (percentage points)1 |
0.62 |
0.39 |
0.39 |
0.46 |
0.38 |
|
The fund's information ratio1,2 |
0.39 |
0.41 |
0.55 |
0.30 |
0.01 |
1 Based on aggregated equity and fixed-income investments until the end of 2016.
2 The fund’s information ratio (IR) is the ratio of the fund’s average monthly relative return to the fund’s tracking error. The IR indicates how much relative return has been achieved per unit of relative risk.
TABLE 11 Contributions from management areas to the fund’s relative return in percentage points in the first half of 2026.
|
Totalt |
|
|---|---|
|
Equity management |
0.23 |
|
Fixed-income management |
0.05 |
|
Real assets management |
0.08 |
|
Asset class allocation |
-0.14 |
|
Total |
0.22 |
Responsible investment
The first half of the year is peak season for voting at the shareholder meetings of the companies the fund is invested in. More than two thirds of companies’ annual general meetings take place in the period from April to June. Voting is one of the most important tools we have for exercising our ownership rights. We voted at 6,899 shareholder meetings in the first half of 2026 and on a total of 75,757 resolutions. All of our voting is updated on an ongoing basis at www.nbim.no. We held 2,058 meetings with companies in the first half of 2026. At 43 percent of these meetings we raised topics such as corporate governance and sustainability. Our questions most often concerned capital management, climate change and human capital.
In November 2025, the Government appointed a committee to review the ethical framework for the fund. The committee is to deliver its report by 15 October 2026.
Financial reporting
Income statement
|
Amounts in NOK million |
Note |
1H 2026 |
1H 2025 |
2025 |
|---|---|---|---|---|
|
Profit/loss on the portfolio before foreign exchange gain/loss |
||||
|
Income/expense from: |
||||
|
- Equities |
4 |
1,697,272 |
552,618 |
2,115,405 |
|
- Bonds |
4 |
49,209 |
143,415 |
243,405 |
|
- Unlisted real estate |
6 |
11,102 |
8,662 |
9,063 |
|
- Unlisted infrastructure |
7 |
818 |
1,426 |
7,313 |
|
- Financial derivatives |
4 |
-1,848 |
2,420 |
1,350 |
|
- Secured lending |
14,767 |
10,232 |
20,801 |
|
|
- Secured borrowing |
-13,713 |
-12,264 |
-22,889 |
|
|
Tax expense |
-3,754 |
-7,237 |
-11,157 |
|
|
Interest income/expense |
-730 |
-749 |
-1,042 |
|
|
Other income/expense |
-11 |
-53 |
-117 |
|
|
Profit/loss on the portfolio before foreign exchange gain/loss |
1,753,110 |
698,467 |
2,362,132 |
|
|
Foreign exchange gain/loss |
10 |
-426,740 |
-1,010,301 |
-1,155,299 |
|
Profit/loss on the portfolio |
1,326,371 |
-311,833 |
1,206,833 |
|
|
Management fee |
11 |
-4,830 |
-3,999 |
-7,537 |
|
Profit/loss and total comprehensive income |
1,321,541 |
-315,832 |
1,199,296 |
Balance sheet
|
Amounts in NOK million |
Note |
30.06.2026 |
31.12.2025 |
|---|---|---|---|
|
Assets |
|||
|
Deposits in banks |
22,115 |
19,394 |
|
|
Secured lending |
1,516,338 |
1,374,213 |
|
|
Cash collateral posted |
18,289 |
20,426 |
|
|
Unsettled trades |
165,376 |
38,765 |
|
|
Equities |
5 |
15,132,058 |
14,217,305 |
|
Equities lent |
5 |
1,373,038 |
1,011,469 |
|
Bonds |
5 |
4,923,602 |
4,987,629 |
|
Bonds lent |
5 |
1,173,306 |
811,514 |
|
Financial derivatives |
5 |
26,506 |
27,597 |
|
Unlisted real estate |
6 |
371,201 |
371,524 |
|
Unlisted infrastructure |
7 |
83,416 |
60,228 |
|
Withholding tax receivable |
15,497 |
11,594 |
|
|
Other assets |
3,191 |
2,165 |
|
|
Total assets |
24,823,932 |
22,953,824 |
|
|
Liabilities and owner's capital |
|||
|
Secured borrowing |
1,749,369 |
1,370,328 |
|
|
Cash collateral received |
149,518 |
129,608 |
|
|
Unsettled trades |
203,136 |
141,044 |
|
|
Financial derivatives |
5 |
26,556 |
26,483 |
|
Deferred tax |
6,917 |
10,744 |
|
|
Other liabilities |
180 |
194 |
|
|
Management fee payable |
4,830 |
7,537 |
|
|
Total liabilities |
2,140,505 |
1,685,938 |
|
|
Owner's capital |
22,683,427 |
21,267,886 |
|
|
Total liabilities and owner's capital |
24,823,932 |
22,953,824 |
Statement of cash flows
|
Amounts in NOK million, receipt (+) / payment (-) |
Note |
1H 2026 |
1H 2025 |
2025 |
|---|---|---|---|---|
|
Operating activities |
||||
|
Receipts of dividend from equities |
150,807 |
162,206 |
274,816 |
|
|
Receipts of interest from bonds |
86,249 |
78,610 |
160,695 |
|
|
Receipts of interest and dividend from unlisted real estate |
6 |
3,922 |
4,254 |
9,070 |
|
Receipts of interest and dividend from unlisted infrastructure |
7 |
352 |
439 |
747 |
|
Net receipts of interest and fee from secured lending and borrowing |
1,126 |
-2,144 |
-2,655 |
|
|
Receipts of dividend, interest and fee from holdings of equities, bonds, unlisted real estate and unlisted infrastructure |
242,455 |
243,365 |
442,673 |
|
|
Net cash flow from purchase and sale of equities |
-12,585 |
-1,095 |
18,918 |
|
|
Net cash flow from purchase and sale of bonds |
-455,598 |
-283,972 |
-552,445 |
|
|
Net cash flow to/from investments in unlisted real estate |
6 |
-3,654 |
-21,246 |
-38,899 |
|
Net cash flow to/from investments in unlisted infrastructure |
7 |
-25,105 |
-20,472 |
-27,955 |
|
Net cash flow financial derivatives |
2,006 |
-1,193 |
-9,528 |
|
|
Net cash flow cash collateral related to derivative transactions |
13,802 |
-53,230 |
19,778 |
|
|
Net cash flow secured lending and borrowing |
163,589 |
-14,970 |
-173,972 |
|
|
Net payment of taxes |
-10,807 |
-3,495 |
-5,574 |
|
|
Net cash flow related to interest on deposits in banks and bank overdraft |
138 |
-80 |
74 |
|
|
Net cash flow related to other income/expense, other assets and other liabilities |
-75 |
-1,565 |
-183 |
|
|
Management fee paid to Norges Bank1 |
-7,537 |
-190 |
-190 |
|
|
Net cash inflow/outflow from operating activities |
-93,373 |
-158,145 |
-327,303 |
|
|
Financing activities |
||||
|
Inflow from the Norwegian government |
93,163 |
158,315 |
326,697 |
|
|
Withdrawal by the Norwegian government |
0 |
0 |
0 |
|
|
Net cash inflow/outflow from financing activities |
93,163 |
158,315 |
326,697 |
|
|
Net change deposits in banks |
||||
|
Deposits in banks at 1 January |
19,394 |
25,550 |
25,550 |
|
|
Net increase/decrease of cash in the period |
-210 |
170 |
-606 |
|
|
Net foreign exchange gain/loss on cash |
2,931 |
-3,617 |
-5,549 |
|
|
Deposits in banks at end of period |
22,115 |
22,102 |
19,394 |
1 The management fee presented in the Statement of cash flows consists of amounts transferred to or withdrawn from the krone account in connection with the settlement of management costs in Norges Bank.
Statement of changes in owner’s capital
|
Amounts in NOK million |
Inflows from owner |
Retained earnings |
Total owner's capital |
|---|---|---|---|
|
1 January 2025 |
5,177,370 |
14,564,220 |
19,741,590 |
|
Profit/loss and total comprehensive income |
0 |
-315,832 |
-315,832 |
|
Inflow during the period |
160,000 |
0 |
160,000 |
|
Withdrawal during the period |
0 |
0 |
0 |
|
30 June 2025 |
5,337,370 |
14,248,388 |
19,585,757 |
|
1 July 2025 |
5,337,370 |
14,248,388 |
19,585,757 |
|
Profit/loss and total comprehensive income |
0 |
1,515,128 |
1,515,128 |
|
Inflow during the period |
167,000 |
0 |
167,000 |
|
Withdrawal during the period |
0 |
0 |
0 |
|
31 December 2025 |
5,504,370 |
15,763,516 |
21,267,886 |
|
1 January 2026 |
5,504,370 |
15,763,516 |
21,267,886 |
|
Profit/loss and total comprehensive income |
0 |
1,321,541 |
1,321,541 |
|
Inflow during the period |
94,000 |
0 |
94,000 |
|
Withdrawal during the period |
0 |
0 |
0 |
|
30 June 2026 |
5,598,370 |
17,085,057 |
22,683,427 |
Notes
Note 1 General information
Introduction
Norges Bank is Norway’s central bank. Norges Bank is a separate legal entity and is owned by the state. Norges Bank manages the Government Pension Fund Global (GPFG) on behalf of the Ministry of Finance, in accordance with section 3, second paragraph of the Government Pension Fund Act and the management mandate for the GPFG, issued by the Ministry of Finance.
The GPFG shall support government saving to finance future expenditure and underpin long-term considerations relating to the use of Norway’s petroleum revenues. The Storting (Norwegian Parliament) has established the legal framework in the Government Pension Fund Act, and the Ministry of Finance has formal responsibility for the fund’s management. The Executive Board of Norges Bank has delegated day-to-day management of the GPFG to Norges Bank Investment Management (NBIM).
The Ministry of Finance has placed funds for investment in the GPFG in the form of a Norwegian krone deposit with Norges Bank (the krone account). Norges Bank manages the krone account in its own name by investing the funds in an investment portfolio consisting of listed equities, bonds, real estate and renewable energy infrastructure. The GPFG is invested in its entirety outside of Norway.
Transfers are made to and from the krone account in accordance with the management mandate. When the Norwegian State’s petroleum revenue exceeds the use of petroleum revenue in the fiscal budget, deposits will be made into the krone account. In the opposite situation, withdrawals will be made. Transfers to and from the krone account lead to a corresponding change in owner’s capital.
Approval of the interim financial statements
The interim financial statements of Norges Bank for the first half of 2026, which comprise only the financial reporting for the GPFG, were approved by the Executive Board on 10 August 2026.
Note 2 Accounting policies
Basis of preparation
In accordance with the Regulation on the financial reporting of Norges Bank (the Regulation), laid down by the Ministry of Finance, the financial reporting for the GPFG is prepared in accordance with IFRS® Accounting Standards as adopted by the EU, on a going concern basis.
The condensed interim financial statements for the first half of 2026 have been prepared in accordance with IAS 34 Interim Financial Reporting. The interim financial statements are presented in Norwegian kroner (NOK) and rounded to the nearest million. Rounding differences may occur.
The interim financial statements have been prepared using the same accounting policies and calculation methods as those applied and disclosed in the 2025 annual report. The condensed interim financial statements do not include all the information and disclosures required in annual financial statements and should therefore be read in conjunction with the 2025 annual report.
Significant estimates and accounting judgements
The preparation of the interim financial statements involves the use of uncertain estimates and assumptions relating to future events that affect the reported amounts for assets, liabilities, income and expenses. Estimates are determined based on historical experience and reflect management’s expectations of future events. Actual outcomes may deviate from estimates. The preparation of the interim financial statements also involves the use of judgement when applying accounting policies, which may have a significant impact on the financial statements.
In cases where there are particularly uncertain estimates or accounting judgements, this is described in the respective notes.
Note 3 Returns
Table 3.1 Returns
|
1H 2026 |
1H 2025 |
2025 |
|
|---|---|---|---|
|
Returns measured in the fund's currency basket (percent) |
|||
|
Return on equity investments |
12.95 |
6.73 |
19.29 |
|
Return on fixed-income investments |
0.88 |
3.31 |
5.42 |
|
Return on unlisted real estate investments |
3.01 |
4.02 |
4.36 |
|
Return on unlisted infrastructure investments |
-0.19 |
9.43 |
18.07 |
|
Return on fund |
9.44 |
5.74 |
15.11 |
|
Relative return on fund (percentage points) |
0.22 |
-0.05 |
-0.28 |
|
Returns measured in Norwegian kroner (percent) |
|||
|
Return on equity investments |
9.60 |
-0.67 |
9.85 |
|
Return on fixed-income investments |
-2.11 |
-3.85 |
-2.92 |
|
Return on unlisted real estate investments |
-0.05 |
-3.19 |
-3.90 |
|
Return on unlisted infrastructure investments |
-3.16 |
1.84 |
8.73 |
|
Return on fund |
6.19 |
-1.59 |
6.00 |
For further information on the calculation methods used in return measurement, see note 3 Returns in the 2025 annual report.
Note 4 Income/expense from equities, bonds and financial derivatives
Tables 4.1 to 4.3 specify the change in fair value in the period, where the line Income/expense shows the amount recognised in the income statement for the relevant income statement line.
Table 4.1 Specification Income/expense from equities
|
Amounts in NOK million |
1H 2026 |
1H 2025 |
2025 |
|---|---|---|---|
|
Dividends |
156,086 |
167,471 |
276,796 |
|
Realised gain/loss |
547,685 |
360,266 |
783,386 |
|
Unrealised gain/loss |
993,500 |
24,882 |
1,055,223 |
|
Income/expense from equities before foreign exchange gain/loss |
1,697,272 |
552,618 |
2,115,405 |
Table 4.2 Specification Income/expense from bonds
|
Amounts in NOK million |
1H 2026 |
1H 2025 |
2025 |
|---|---|---|---|
|
Interest |
92,198 |
85,375 |
178,836 |
|
Realised gain/loss |
-24,475 |
-20,773 |
-20,660 |
|
Unrealised gain/loss |
-18,514 |
78,813 |
85,230 |
|
Income/expense from bonds before foreign exchange gain/loss |
49,209 |
143,415 |
243,405 |
Table 4.3 Specification Income/expense from financial derivatives
|
Amounts in NOK million |
1H 2026 |
1H 2025 |
2025 |
|---|---|---|---|
|
Interest |
1,054 |
488 |
866 |
|
Realised gain/loss |
1,569 |
4,278 |
-4,353 |
|
Unrealised gain/loss |
-4,471 |
-2,347 |
4,837 |
|
Income/expense from financial derivatives before foreign exchange gain/loss |
-1,848 |
2,420 |
1,350 |
Note 5 Holdings of equities, bonds and financial derivatives
Table 5.1 specifies investments in equities by sector.
Table 5.1 Equities
|
Amounts in NOK million |
30.06.2026 Fair value incl. earned dividends |
31.12.2025 Fair value incl. earned dividends |
|---|---|---|
|
Technology |
5,287,985 |
4,322,534 |
|
Financials |
2,592,158 |
2,560,735 |
|
Consumer discretionary |
1,851,117 |
2,011,834 |
|
Industrials |
2,120,924 |
1,928,892 |
|
Health care |
1,391,416 |
1,423,670 |
|
Consumer staples |
589,953 |
586,120 |
|
Real estate |
600,241 |
642,830 |
|
Basic materials |
566,445 |
515,072 |
|
Energy |
482,416 |
429,186 |
|
Telecommunications |
624,547 |
445,093 |
|
Utilities |
397,894 |
362,809 |
|
Total equities |
16,505,096 |
15,228,774 |
|
Of which presented in the balance sheet line Equities |
15,132,058 |
14,217,305 |
|
Of which presented in the balance sheet line Equities lent |
1,373,038 |
1,011,469 |
At the end of the first half of 2026, earned dividends amounted to NOK 14,672 million (NOK 11,115 million at the end of 2025).
Table 5.2 specifies investments in bonds by category. Notional value represents the amount to be repaid at maturity, also referred to as the par value of the bond.
Table 5.2 Bonds
|
30.06.2026 |
31.12.2025 |
|||
|---|---|---|---|---|
|
Amounts in NOK million |
Notional value |
Fair value incl. earned interest |
Notional value |
Fair value incl. earned interest |
|
Government bonds |
3,451,852 |
3,227,236 |
3,387,913 |
3,200,365 |
|
Government-related bonds |
622,945 |
608,471 |
524,378 |
513,092 |
|
Inflation-linked bonds |
402,402 |
375,708 |
363,616 |
342,561 |
|
Corporate bonds |
1,583,911 |
1,542,592 |
1,441,581 |
1,412,864 |
|
Securitised bonds |
355,595 |
342,901 |
343,058 |
330,261 |
|
Total bonds |
6,416,705 |
6,096,908 |
6,060,546 |
5,799,143 |
|
Of which presented in the balance sheet line Bonds |
4,923,602 |
4,987,629 |
||
|
Of which presented in the balance sheet line Bonds lent |
1,173,306 |
811,514 |
||
At the end of the first half of 2026, earned interest amounted to NOK 57,314 million (NOK 56,924 million at the end of 2025).
Financial derivatives
Financial derivatives are used in the management of the fund to adjust exposure within different portfolios, as a cost-effective alternative to trading in the underlying securities. Foreign exchange derivatives are also used in connection with liquidity management. Equity derivatives with an option component are often the result of corporate actions and can be converted into equities or sold. The GPFG also uses equity swaps in combination with purchase or sale of equities. Equity swaps are not recognised in the balance sheet, see the accounting policy in note 13 Secured lending and borrowing in the 2025 annual report for further information.
Table 5.3 specifies financial derivatives recognised in the balance sheet. Notional amounts are the basis for calculating any cash flows and gains/losses for the derivative contracts. This provides information on the extent to which different types of financial derivatives are used.
Table 5.3 Financial derivatives
|
30.06.2026 |
31.12.2025 |
|||||
|---|---|---|---|---|---|---|
|
Amounts in NOK million |
Notional amount |
Fair value |
Notional amount |
Fair value |
||
|
Asset |
Liability |
Asset |
Liability |
|||
|
Foreign exchange derivatives |
916,686 |
6,202 |
5,492 |
913,773 |
3,928 |
5,774 |
|
Interest rate derivatives |
7,974,221 |
18,527 |
9,969 |
5,630,066 |
21,971 |
12,428 |
|
Credit derivatives |
264,906 |
1,490 |
10,994 |
209,308 |
1,421 |
8,233 |
|
Equity derivatives1 |
17,902 |
138 |
44 |
0 |
141 |
0 |
|
Exchange-traded futures contracts2 |
183,976 |
150 |
57 |
167,303 |
137 |
48 |
|
Total financial derivatives |
9,357,691 |
26,506 |
26,556 |
6,920,450 |
27,597 |
26,483 |
1 Notional amount is not considered to be relevant for rights and warrants. Notional amount for these instruments is therefore not included in the table.
2 Exchange-traded futures contracts have daily margin payments and the net carrying amount is normally zero at the balance sheet date, with the exception of futures contracts in certain markets where the market value used for margining and the carrying amount are determined at different points in time.
Note 6 Unlisted real estate
Investments in unlisted real estate are made through subsidiaries of Norges Bank, exclusively established as part of the management of the GPFG. Subsidiaries presented in the balance sheet as Unlisted real estate are measured at fair value through profit or loss. The fair value of unlisted real estate corresponds to the sum of the GPFG’s share of assets and liabilities in the underlying real estate subsidiaries, measured at fair value. For further information, see note 2 Accounting policies and note 8 Fair value measurement in the 2025 annual report.
The tables below specify income/expense, changes in carrying amounts and cash flows related to investments in unlisted real estate. For further information on the principles applied in the tables, see note 6 Unlisted real estate in the 2025 annual report.
Table 6.1 Income/expense from unlisted real estate
|
Amounts in NOK million |
1H 2026 |
1H 2025 |
2025 |
|---|---|---|---|
|
Receipts of interest and dividend |
3,922 |
4,254 |
9,070 |
|
Unrealised gain/loss |
7,180 |
4,408 |
-7 |
|
Income/expense from unlisted real estate before foreign exchange gain/loss1 |
11,102 |
8,662 |
9,063 |
1 Earned interest and dividends which are not cash-settled are included in Unrealised gain/loss.
Table 6.2 Changes in carrying amounts unlisted real estate
|
Amounts in NOK million |
30.06.2026 |
31.12.2025 |
|---|---|---|
|
Unlisted real estate at 1 January |
371,524 |
355,769 |
|
Net cash flow to/from investments in unlisted real estate |
3,654 |
38,899 |
|
Unrealised gain/loss |
7,180 |
-7 |
|
Foreign exchange gain/loss |
-11,157 |
-23,137 |
|
Unlisted real estate, closing balance for the period |
371,201 |
371,524 |
Table 6.3 specifies cash flows between the GPFG and subsidiaries presented as Unlisted real estate.
Table 6.3 Cash flow unlisted real estate
|
Amounts in NOK million |
1H 2026 |
1H 2025 |
2025 |
|---|---|---|---|
|
Receipts of interest |
1,317 |
1,243 |
2,988 |
|
Receipts of dividends |
2,604 |
3,010 |
6,083 |
|
Receipts of interest and dividend from unlisted real estate |
3,922 |
4,254 |
9,070 |
|
|
|||
|
Payments to unlisted real estate subsidiaries |
-5,979 |
-21,933 |
-40,805 |
|
Repayments from unlisted real estate subsidiaries |
2,325 |
686 |
1,905 |
|
Net cash flow to/from investments in unlisted real estate |
-3,654 |
-21,246 |
-38,899 |
Underlying real estate companies
Real estate subsidiaries have investments in other non-consolidated, unlisted companies. For further information, see note 16 Interests in other entities in the 2025 annual report.
Principles for presentation
The following principles apply for the respective income and expense elements in the underlying real estate companies presented in table 6.4:
Net revenue mainly comprises net rental income, which is recognised on a straight-line basis over the lease term. Net rental income mainly comprises accrued rental income, less costs relating to the operation and maintenance of properties.
Asset management fees are directly related to the underlying properties and are primarily linked to the operation and development of properties and leases. Fixed fees are expensed as incurred.
Variable fees are based on achieved performance over time. The provision for variable fees is based on the best estimate of the incurred fees to be paid. The change in best estimate in the period is recognised in profit or loss.
Investment management fees consist of fees to external managers related to investments in unlisted funds. Fixed fees are calculated as a fixed share of committed capital or net asset value, expressed in basis points.
Transaction costs and fees from purchases and sales of properties are incurred as one-off costs and expensed as incurred.
Table 6.4 specifies the GPFG’s share of net income generated in the underlying real estate companies, which is the basis for Income/expense from unlisted real estate presented in table 6.1.
Table 6.4 Income from underlying real estate companies
|
Amounts in NOK million |
1H 2026 |
1H 2025 |
2025 |
|---|---|---|---|
|
Net rental income |
9,542 |
8,525 |
17,325 |
|
Operating costs |
-311 |
-148 |
-381 |
|
Asset management fees - fixed |
-683 |
-648 |
-1,341 |
|
Asset management fees - variable |
-1 |
-1 |
-9 |
|
Investment management fees |
-9 |
0 |
-6 |
|
Interest income/expense |
-523 |
-468 |
-999 |
|
Tax expense |
-184 |
-154 |
-328 |
|
Transaction costs and fees |
-103 |
-391 |
-725 |
|
Realised and unrealised gain/loss |
3,373 |
1,946 |
-4,473 |
|
Net income underlying real estate companies |
11,102 |
8,662 |
9,063 |
Note 7 Unlisted renewable energy infrastructure
Investments in unlisted renewable energy infrastructure (Unlisted infrastructure) are made through subsidiaries of Norges Bank, exclusively established as part of the management of the GPFG. Subsidiaries presented in the balance sheet as Unlisted infrastructure are measured at fair value through profit or loss. The fair value of unlisted infrastructure corresponds to the GPFG’s share of the equity value of the underlying infrastructure companies, measured at fair value. For further information, see note 2 Accounting policies and note 8 Fair value measurement in the 2025 annual report.
The tables below specify income/expense, changes in carrying amounts and cash flows related to investments in unlisted infrastructure. For further information on the principles underlying the tables, see note 7 Unlisted renewable energy infrastructure in the 2025 annual report.
Table 7.1 Income/expense from unlisted infrastructure
|
Amounts in NOK million |
1H 2026 |
1H 2025 |
2025 |
|---|---|---|---|
|
Receipts of interest and dividend |
352 |
439 |
747 |
|
Unrealised gain/loss |
466 |
986 |
6,566 |
|
Income/expense from unlisted infrastructure before foreign exchange gain/loss1 |
818 |
1,426 |
7,313 |
1 Earned interest and dividends which are not cash-settled are included in Unrealised gain/loss.
Table 7.2 Changes in carrying amounts unlisted infrastructure
|
Amounts in NOK million |
30.06.2026 |
31.12.2025 |
|---|---|---|
|
Unlisted infrastructure at 1 January |
60,228 |
25,236 |
|
Net cash flow to/from investments in unlisted infrastructure |
25,105 |
27,955 |
|
Unrealised gain/loss |
466 |
6,566 |
|
Foreign exchange gain/loss |
-2,383 |
471 |
|
Unlisted infrastructure, closing balance for the period |
83,416 |
60,228 |
Table 7.3 specifies cash flows between the GPFG and subsidiaries presented as Unlisted infrastructure.
Table 7.3 Cash flow unlisted infrastructure
|
Amounts in NOK million |
1H 2026 |
1H 2025 |
2025 |
|---|---|---|---|
|
Receipts of interest |
218 |
247 |
457 |
|
Receipts of dividends |
133 |
192 |
290 |
|
Receipts of interest and dividend from unlisted infrastructure |
352 |
439 |
747 |
|
Payments to unlisted infrastructure subsidiaries |
-25,408 |
-20,647 |
-28,394 |
|
Repayments from unlisted infrastructure subsidiaries |
304 |
174 |
439 |
|
Net cash flow to/from investments in unlisted infrastructure |
-25,105 |
-20,472 |
-27,955 |
Underlying infrastructure companies
Infrastructure subsidiaries have investments in other non-consolidated, unlisted companies. For further information, see note 16 Interests in other entities in the 2025 annual report.
Principles for presentation
The following principles apply for the respective income and expense elements in the infrastructure companies presented in table 7.4:
Net revenue mainly comprises income from the sale of renewable energy and distributions from fund investments. Net income from the sale of renewable energy mainly comprises accrued income, less costs relating to the operation and maintenance of the infrastructure assets.
Investment management fees consist of fees to external managers related to investments in unlisted funds. Fixed fees are calculated as a fixed share of committed capital or net asset value, expressed in basis points.
Transaction costs and fees from purchases of renewable energy infrastructure are incurred as one-off costs and expensed as incurred.
Table 7.4 specifies the GPFG’s share of net income generated in the underlying infrastructure companies, which is the basis for Income/expense from unlisted infrastructure presented in table 7.1.
Table 7.4 Income from underlying infrastructure companies
|
Amounts in NOK million |
1H 2026 |
1H 2025 |
2025 |
|---|---|---|---|
|
Net revenue |
1,573 |
881 |
2,582 |
|
Operating costs |
-210 |
-81 |
-418 |
|
Investment management fees |
-100 |
-11 |
-172 |
|
Interest income/expense |
-83 |
-66 |
-198 |
|
Tax expense |
-169 |
-132 |
-154 |
|
Transaction costs and fees |
-183 |
-8 |
-207 |
|
Unrealised gain/loss |
-11 |
844 |
5,879 |
|
Net income underlying infrastructure companies |
818 |
1,426 |
7,313 |
Note 8 Fair value measurement
Fair value for the majority of assets and liabilities is based on quoted market prices or observable market inputs. If the market is not active, fair value is established using valuation techniques that maximise the use of relevant observable inputs. Estimating fair value can be complex and requires the use of judgement, particularly when observable inputs are not available. For an overview of valuation techniques and methods, as well as definitions and the categorisation into the three categories in the fair value hierarchy, see note 8 Fair value measurement in the 2025 annual report.
Significant estimate
Classification in the fair value hierarchy is based on set criteria, some of which may require the use of judgement.
Level 3 investments consist of instruments measured at fair value that are not traded or quoted in an active market. Fair value is determined using valuation techniques that use models with significant use of unobservable inputs. A considerable degree of judgement is applied in determining the assumptions that market participants would use when pricing the asset or liability, when observable market data is not available.
The fair value hierarchy
Table 8.1 Categorisation of the investment portfolio by level in the fair value hierarchy
|
Level 1 |
Level 2 |
Level 3 |
Total |
|||||
|---|---|---|---|---|---|---|---|---|
|
Amounts in NOK million |
30.06.2026 |
31.12.2025 |
30.06.2026 |
31.12.2025 |
30.06.2026 |
31.12.2025 |
30.06.2026 |
31.12.2025 |
|
Equities |
16,460,968 |
15,192,762 |
42,467 |
34,289 |
1,661 |
1,723 |
16,505,096 |
15,228,774 |
|
Government bonds |
3,090,300 |
2,812,904 |
136,936 |
387,462 |
0 |
0 |
3,227,236 |
3,200,365 |
|
Government-related bonds |
549,360 |
441,716 |
58,060 |
70,274 |
1,051 |
1,101 |
608,471 |
513,092 |
|
Inflation-linked bonds |
372,664 |
282,635 |
3,044 |
59,926 |
0 |
0 |
375,708 |
342,561 |
|
Corporate bonds |
1,536,152 |
1,388,752 |
6,440 |
24,111 |
0 |
1 |
1,542,592 |
1,412,864 |
|
Securitised bonds |
336,382 |
277,233 |
6,519 |
53,028 |
0 |
0 |
342,901 |
330,261 |
|
Total bonds |
5,884,858 |
5,203,240 |
210,999 |
594,801 |
1,051 |
1,102 |
6,096,908 |
5,799,143 |
|
Financial derivatives (assets) |
1,558 |
68 |
24,948 |
27,522 |
0 |
7 |
26,506 |
27,597 |
|
Financial derivatives (liabilities) |
-10,794 |
-1,187 |
-15,762 |
-25,296 |
0 |
0 |
-26,556 |
-26,483 |
|
Total financial derivatives |
-9,236 |
-1,119 |
9,186 |
2,226 |
0 |
7 |
-50 |
1,114 |
|
Unlisted real estate |
0 |
0 |
0 |
0 |
371,201 |
371,524 |
371,201 |
371,524 |
|
Unlisted infrastructure |
0 |
0 |
0 |
0 |
83,416 |
60,228 |
83,416 |
60,228 |
|
Other (assets)1 |
0 |
0 |
1,740,806 |
1,466,556 |
0 |
0 |
1,740,805 |
1,466,556 |
|
Other (liabilities)2 |
0 |
0 |
-2,102,203 |
-1,641,173 |
0 |
0 |
-2,102,202 |
-1,641,173 |
|
Market value investment portfolio3 |
22,336,589 |
20,394,882 |
-98,745 |
456,699 |
457,329 |
434,584 |
22,695,173 |
21,286,167 |
|
Total assets (percent) |
90.0 |
88.9 |
8.1 |
9.2 |
1.9 |
1.9 |
100.0 |
100.0 |
|
Total liabilities (percent) |
0.5 |
0.1 |
99.5 |
99.9 |
0.0 |
0.0 |
100.0 |
100.0 |
|
Total (percent)4 |
98.4 |
95.8 |
-0.4 |
2.2 |
2.0 |
2.0 |
100.0 |
100.0 |
1 Other (assets) consists of the balance sheet lines Deposits in banks, Secured lending, Cash collateral posted, Unsettled trades (assets), Withholding tax receivable and Other assets.
2 Other (liabilities) consists of the balance sheet lines Secured borrowing, Cash collateral received, Unsettled trades (liabilities) and Other liabilities.
3 The market value of the investment portfolio excludes Management fee payable and Deferred tax.
4 The net market value of the investment portfolio in Level 2 at the end of the second quarter of 2026 is a liability of NOK 98,745 million, mainly due to liabilities related to Secured borrowing presented under Other (liabilities).
The majority of the total portfolio is priced based on observable market prices. At the end of the first half of 2026, 98.0 percent of the portfolio was classified as Level 1 or 2, which is unchanged from year-end 2025.
Equities
Measured as a share of total value, virtually all equities (99.73 percent) were valued based on official closing prices from stock exchanges and classified as Level 1 at the end of the first half. A small share of equities (0.26 percent) were classified as Level 2. These are mainly equities that are valued based on derived prices. The share of equity holdings valued with significant use of unobservable inputs and classified as Level 3 was 0.01 percent. These are equities that are not listed, or where trading has been suspended and an adjustment has been applied to the last traded price based on company- or country-specific factors.
Bonds
The majority of bond holdings have observable, executable market quotes in active markets and 96.52 percent of holdings were classified as Level 1 at the end of the first half. Bond holdings that do not have a sufficient number of observable quotes or that are priced based on comparable liquid bonds are classified as Level 2. These amounted to 3.46 percent of bond holdings at the end of the first half. An insignificant share of holdings (0.02 percent) that did not have observable quotes were classified as Level 3, since the valuation was based on significant use of unobservable inputs.
Unlisted real estate and unlisted renewable energy infrastructure
All investments in unlisted real estate and unlisted renewable energy infrastructure are classified as Level 3, since models are used to value the underlying assets and liabilities with extensive use of unobservable inputs. Properties and direct investments in unlisted infrastructure are measured at the value determined by external valuers. Investments in unlisted funds are measured at the fair value reported by the fund manager. Exceptions to this are recent investments where the purchase price, excluding transaction costs, is normally considered to be the best estimate of fair value, or cases where there are indications that the value determined by external valuers or fund managers does not reflect fair value, so that an adjustment of the valuation is warranted.
Financial derivatives
Some equity derivatives (rights and warrants) and credit default swaps for indices («CDS Indices») that are actively traded on an exchange are classified as Level 1. The majority of derivatives are classified as Level 2, since the valuation of these is based on standard models using observable market inputs. Certain derivatives are valued based on models with significant use of unobservable inputs and are classified as Level 3.
Other assets and liabilities that are part of the investment portfolio are classified as Level 2.
Movements between the levels in the fair value hierarchy
There were no significant reclassifications of equity holdings between levels in the fair value hierarchy in the first half.
Bond holdings with a net value of NOK 361 billion were reclassified from Level 2 to Level 1 in the first half, mainly due to improved liquidity for certain government bond holdings. The reclassification of NOK 364 billion was partly offset by bonds with a value of NOK 3 billion reclassified from Level 1 to Level 2. There were no significant reclassifications of bonds into or out of Level 3 in the first half.
Table 8.2 Changes in Level 3 holdings
|
Amounts in NOK million |
01.01.2026 |
Purchases |
Sales |
Settlements |
Net gain/loss |
Transferred into Level 3 |
Transferred out of Level 3 |
Foreign exchange gain/loss |
30.06.2026 |
|---|---|---|---|---|---|---|---|---|---|
|
Equities |
1,723 |
4 |
-10 |
0 |
-23 |
9 |
-14 |
-28 |
1,661 |
|
Bonds |
1,102 |
0 |
0 |
-27 |
-20 |
115 |
-97 |
-21 |
1,051 |
|
Financial derivatives (assets) |
7 |
0 |
-7 |
0 |
-1 |
1 |
0 |
0 |
0 |
|
Unlisted real estate1 |
371,524 |
3,654 |
0 |
0 |
7,180 |
0 |
0 |
-11,157 |
371,201 |
|
Unlisted infrastructure1 |
60,228 |
25,105 |
0 |
0 |
466 |
0 |
0 |
-2,383 |
83,416 |
|
Total |
434,584 |
28,763 |
-18 |
-27 |
7,602 |
125 |
-111 |
-13,590 |
457,329 |
|
Amounts in NOK million |
01.01.2025 |
Purchases |
Sales |
Settlements |
Net gain/loss |
Transferred into Level 3 |
Transferred out of Level 3 |
Foreign exchange gain/loss |
31.12.2025 |
|---|---|---|---|---|---|---|---|---|---|
|
Equities |
1,630 |
43 |
-97 |
12 |
-156 |
182 |
-27 |
136 |
1,723 |
|
Bonds |
1,390 |
0 |
0 |
-39 |
34 |
0 |
-144 |
-139 |
1,102 |
|
Financial derivatives (assets) |
10 |
7 |
0 |
0 |
0 |
0 |
-10 |
0 |
7 |
|
Unlisted real estate1 |
355,769 |
38,899 |
0 |
0 |
-7 |
0 |
0 |
-23,137 |
371,524 |
|
Unlisted infrastructure1 |
25,236 |
27,955 |
0 |
0 |
6,566 |
0 |
0 |
471 |
60,228 |
|
Total |
384,035 |
66,904 |
-97 |
-27 |
6,437 |
182 |
-181 |
-22,669 |
434,584 |
1 Purchases represent the net cash flow to investments in unlisted real estate and unlisted infrastructure, respectively, as presented in the Statement of cash flows.
The relative share of holdings classified as Level 3 was 2.0 percent at the end of the first half, which is unchanged compared with year-end 2025. The GPFG’s total Level 3 holdings amounted to NOK 457,329 million at the end of the first half, an increase of 22,745 million from year-end 2025. The increase is mainly due to investments in unlisted real estate and unlisted renewable energy infrastructure, which are classified in their entirety as Level 3.
Russian equity holdings accounted for the majority of equity holdings classified as Level 3 at the end of the first half. These holdings had a value of NOK 1.4 billion at the end of the first half, which is unchanged compared with year-end 2025.
Sensitivity analysis for Level 3 holdings
The valuation of holdings in Level 3 involves the use of judgement when determining the assumptions that market participants would use when observable market data is not available.
Investments in unlisted real estate represent by far the largest part of holdings classified as Level 3. The sensitivity analysis in table 8.3 shows the effect of using reasonable alternative assumptions in the valuation of unlisted real estate. For other holdings classified as Level 3, there have been no significant changes in sensitivity compared with year-end 2025.
Table 8.3 Additional specification Level 3 and sensitivities - unlisted real estate
|
Amounts in NOK million |
Key assumptions |
Change in key assumptions |
Specification of Level 3 holdings 30.06.2026 |
Sensitivities 30.06.2026 |
Change in key assumptions |
Specification of Level 3 holdings 31.12.2025 |
Sensitivities 30.06.2025 |
||
|---|---|---|---|---|---|---|---|---|---|
|
Favourable changes |
Favourable changes |
||||||||
|
Unlisted real estate |
Yield |
0.25 percentage point |
-18,081 |
20,253 |
0.25 percentage point |
-18,096 |
20,270 |
||
|
Market rent |
2.0 percent |
-5,615 |
5,622 |
2.0 percent |
-5,620 |
5,627 |
|||
|
371,201 |
-23,695 |
25,875 |
371,524 |
-23,716 |
25,897 |
||||
Changes in key assumptions can have a material effect on the valuation of investments in unlisted real estate. Several key assumptions are used, of which yields and market rents are the assumptions that have the largest impact when estimating property values. This is illustrated in the sensitivity analysis by using other reasonable alternative assumptions for yield and market rents. The sensitivity analysis is based on a statistically relevant sample that is representative for the unlisted real estate portfolio, and reflects both favourable and unfavourable changes. At the end of the first half, a change in yield of 0.25 percentage points and a change in market rent of 2 percent are considered to be a reasonable range of possible alternative assumptions.
Under an unfavourable change, an increase in yield of 0.25 percentage points and a reduction in market rent of 2 percent are estimated to reduce the value of the unlisted real estate portfolio by approximately NOK 23,695 million, or 6.4 percent (6.4 percent at year-end 2025). Under a favourable change, a reduction in yield of 0.25 percentage points and an increase in market rent of 2 percent would increase the value of the unlisted real estate portfolio by approximately NOK 25,875 million, or 7.0 percent (7.0 percent at year-end 2025). The isolated effect of changes in yield and future market rent is presented in table 8.3.
Changes outside of the ranges specified above are considered to be less reasonable alternative assumptions, however if the range of alternative assumptions were to be expanded, the value changes would be approximately linear.
Note 9 Investment risk
Investment risk comprises market risk, credit risk and counterparty risk. For a further description of the investment risk framework, including the main dimensions and measurement methods used to manage investment risk, see note 9 Investment risk in the 2025 annual report.
Market risk
Market risk is the risk of loss or a change in the market value of the portfolio, or parts of it, due to changes in variables in the financial markets, as well as real estate and infrastructure values. Norges Bank Investment Management measures market risk both for the actual portfolio and the relative market risk of the investments for the GPFG.
Asset class by country/currency
The portfolio is invested across several asset classes, countries and currencies, as shown in table 9.1.
Table 9.1 Allocation by asset class, country and currency
|
Market value in percent by country and currency1 |
Market value by asset class in percent |
Market value by asset class in NOK million |
||||||
|---|---|---|---|---|---|---|---|---|
|
Asset class |
Market |
30.06.2026 |
Market |
31.12.2025 |
30.06.2026 |
31.12.2025 |
30.06.2026 |
31.12.2025 |
|
Equities |
Developed |
89.2 |
Developed |
89.0 |
||||
|
US |
52.9 |
US |
53.6 |
|||||
|
Japan |
6.8 |
Japan |
6.4 |
|||||
|
UK |
4.4 |
UK |
4.8 |
|||||
|
South Korea |
4.1 |
Germany |
3.3 |
|||||
|
Switzerland |
2.9 |
Switzerland |
3.2 |
|||||
|
Total other |
18.0 |
Total other |
17.7 |
|||||
|
Emerging |
10.8 |
Emerging |
11.0 |
|||||
|
Taiwan |
3.9 |
China |
3.6 |
|||||
|
China |
2.9 |
Taiwan |
2.7 |
|||||
|
India |
1.7 |
India |
2.1 |
|||||
|
South Africa |
0.5 |
South Africa |
0.6 |
|||||
|
Brazil |
0.4 |
Brazil |
0.4 |
|||||
|
Total other |
1.4 |
Total other |
1.6 |
|||||
|
Total equities |
72.08 |
71.28 |
16,357,808 |
15,173,080 |
||||
|
Bonds |
Developed |
99.8 |
Developed |
99.8 |
||||
|
US dollar |
54.2 |
US dollar |
53.8 |
|||||
|
Euro |
27.2 |
Euro |
27.6 |
|||||
|
Japanese yen |
5.1 |
Japanese yen |
5.4 |
|||||
|
British pound |
4.6 |
British pound |
4.6 |
|||||
|
Canadian dollar |
3.9 |
Canadian dollar |
4.0 |
|||||
|
Total other |
4.9 |
Total other |
4.4 |
|||||
|
Emerging2 |
0.2 |
Emerging2 |
0.2 |
|||||
|
Total bonds |
25.82 |
26.54 |
5,860,115 |
5,649,375 |
||||
|
Unlisted real estate |
US |
45.2 |
US |
43.6 |
||||
|
UK |
23.4 |
UK |
23.6 |
|||||
|
France |
16.7 |
France |
17.4 |
|||||
|
Germany |
5.1 |
Germany |
5.2 |
|||||
|
Switzerland |
2.8 |
Switzerland |
3.0 |
|||||
|
Total other |
6.8 |
Total other |
7.2 |
|||||
|
Total unlisted real estate |
1.64 |
1.75 |
372,805 |
372,377 |
||||
|
Total unlisted infrastructure |
0.46 |
0.43 |
104,445 |
91,335 |
||||
|
Market value investment portfolio3 |
22,695,173 |
21,286,167 |
||||||
1 Market value in percent by country and currency includes derivatives and cash. At the end of the first half of 2026, the difference between the market value of the asset class unlisted infrastructure and the carrying amount is 21 billion kroner (31 billion kroner at year-end 2025). This is cash allocated to the asset class that has not yet been distributed to the subsidiaries.
2 The share of the bond portfolio in individual emerging market currencies is insignificant.
3 The market value of the investment portfolio excludes Management fee payable and Deferred tax.
At the end of the first half, the fund’s equity share was 72.1 percent, compared with 71.3 percent at year-end 2025. The bond portfolio’s share of the fund was 25.8 percent, compared with 26.5 percent at year-end. Unlisted real estate accounted for 1.6 percent of the fund, compared with 1.7 percent at year-end. Unlisted infrastructure accounted for 0.5 percent of the fund, compared with 0.4 percent at year-end.
Volatility and correlation risk
Norges Bank Investment Management uses models to quantify the risk of fluctuations in value for all or parts of the portfolio. Volatility is a standard risk measure based on the statistical concept of standard deviation, which takes into account the correlation between different investments in the portfolio. Expected volatility is defined as one standard deviation. This risk measure provides an estimate of how much the current portfolio value can be expected to fluctuate during the course of a year, based on market conditions over the past three years. In two out of three years, the portfolio’s return is expected to fall within the negative and positive value of the metric. Expected volatility can be expressed in terms of the portfolio’s absolute or relative risk. Norges Bank Investment Management uses the same model both for portfolio risk and relative volatility.
All of the fund’s investments are included in the calculation of expected relative volatility, and are measured against the fund’s benchmark index consisting of global equity and bond indices.
Tables 9.2 and 9.3 present risk both in terms of the portfolio’s absolute risk and in terms of relative risk.
Table 9.2 Portfolio risk, expected volatility, percent
|
Expected volatility, actual portfolio |
||||||||
|---|---|---|---|---|---|---|---|---|
|
30.06.2026 |
Min 2026 |
Max 2026 |
Average 2026 |
31.12.2025 |
Min 2025 |
Max 2025 |
Average 2025 |
|
|
Portfolio |
11.1 |
10.4 |
11.1 |
10.7 |
10.9 |
10.5 |
11.5 |
11.2 |
|
Equities |
13.7 |
12.6 |
13.7 |
13.0 |
13.2 |
12.7 |
13.9 |
13.5 |
|
Bonds |
9.2 |
9.0 |
10.2 |
9.7 |
10.1 |
10.1 |
11.2 |
10.5 |
|
Unlisted real estate |
12.9 |
12.8 |
13.7 |
13.2 |
13.7 |
13.6 |
14.1 |
13.9 |
|
Unlisted infrastructure |
9.6 |
9.6 |
11.7 |
10.7 |
11.3 |
9.8 |
25.7 |
13.0 |
Table 9.3 Relative risk measured against the fund’s reference index, expected relative volatility, basis points
|
Expected relative volatility |
||||||||
|---|---|---|---|---|---|---|---|---|
|
30.06.2026 |
Min 2026 |
Max 2026 |
Average 2026 |
31.12.2025 |
Min 2025 |
Max 2025 |
Average 2025 |
|
|
Portfolio |
33 |
30 |
37 |
33 |
37 |
37 |
45 |
42 |
Risk measured as expected volatility indicates an expected annual fluctuation in the value of the fund of 11.1 percent, or approximately 2,500 billion kroner, at the end of the first half, compared with 10.9 percent at year-end 2025. The expected volatility of the equity investments was 13.7 percent at the end of the first half, up from 13.2 percent at year-end, while the expected volatility of the fixed-income investments was 9.2 percent, down from 10.1 percent at year-end.
The management mandate stipulates that the fund’s expected relative volatility shall not exceed 1.25 percentage points. The fund’s expected relative volatility was 33 basis points at the end of the first half, compared with 37 basis points at year-end 2025.
Expected shortfall is a tail risk measure that measures the expected loss in extreme market situations. Expected shortfall for the portfolio measured against its benchmark index is estimated using historical simulations based on current investments. The model weights weekly relative returns equally over a period from January 2007 to the end of the most recent accounting period, so that the metric captures extreme market movements. Expected shortfall is calculated as the average loss beyond the 97.5 percentile, i.e. the expected loss when the outcome falls within the worst 2.5 percent of the weekly relative returns.
The Executive Board has determined that the fund shall be managed so that the annual expected shortfall measured against the benchmark index does not exceed 3.75 percentage points. At the end of the first half, expected shortfall was 0.93 percentage points, compared with 1.01 percentage points at year-end 2025.
Credit risk
Credit risk is the risk of loss as a result of bond issuers failing to meet their payment obligations. Fixed-income instruments in the portfolio’s benchmark index are all credit rated as having low credit risk by one of the major credit rating agencies. Investments in bonds are made on the basis of our own assessments of expected return and risk profile.
Table 9.4 Bond portfolio specified by credit rating
|
Amounts in NOK million, 30.06.2026 |
AAA |
AA |
A |
BBB |
Lower rating |
Total |
|---|---|---|---|---|---|---|
|
Government bonds |
567,712 |
2,078,522 |
454,430 |
97,351 |
19,967 |
3,217,982 |
|
Government-related bonds |
267,486 |
229,835 |
76,009 |
31,014 |
4,126 |
608,471 |
|
Inflation-linked bonds |
78,015 |
249,254 |
25,243 |
21,218 |
1,979 |
375,708 |
|
Corporate bonds |
4,696 |
115,916 |
701,663 |
690,337 |
29,980 |
1,542,592 |
|
Securitised bonds |
314,078 |
26,499 |
2,324 |
0 |
0 |
342,901 |
|
Total bonds1 |
1,231,986 |
2,700,026 |
1,259,669 |
839,921 |
56,052 |
6,087,653 |
|
Amounts in NOK million, 30.06.2025 |
AAA |
AA |
A |
BBB |
Lower rating |
Total |
|---|---|---|---|---|---|---|
|
Government bonds |
576,052 |
2,040,965 |
451,447 |
89,207 |
28,986 |
3,186,656 |
|
Government-related bonds |
246,443 |
194,223 |
46,408 |
22,117 |
3,900 |
513,092 |
|
Inflation-linked bonds |
63,886 |
224,239 |
27,216 |
26,483 |
738 |
342,561 |
|
Corporate bonds |
5,168 |
98,910 |
669,435 |
615,070 |
24,281 |
1,412,864 |
|
Securitised bonds |
302,672 |
24,826 |
2,763 |
0 |
0 |
330,261 |
|
Total bonds1 |
1,194,221 |
2,583,164 |
1,197,267 |
752,876 |
57,905 |
5,785,434 |
At the end of the first half of 2026, bonds received as collateral with a value of NOK 9.3 billion had been sold. At year-end 2025, NOK 13.7 billion had been sold. These bonds are presented in the balance sheet as a liability under Secured borrowing.
The market value of the bond portfolio increased by NOK 302 billion compared with year-end 2025, to NOK 6,088 billion at the end of the first half. The share of bond holdings categorised with a credit rating of AAA was reduced to 20.2 percent at the end of the first half, from 20.6 percent at the end of 2025. The decline in the AAA category is mainly due to reduced holdings of German government bonds. The share of bonds in the BBB credit rating category increased to 13.8 percent, from 13.0 percent at year-end 2025. The increase in the BBB category is mainly due to purchases of corporate bonds in this category. The share of bond holdings in the Lower rating category was reduced to 0.9 percent at the end of the first half, from 1.0 percent at year-end. This is mainly due to reduced holdings of Brazilian and South African government bonds. Overall, the credit quality of the bond portfolio is broadly unchanged since year-end.
Counterparty risk
Counterparty risk is the risk of loss related to a counterparty going bankrupt or otherwise failing to meet its obligations.
Table 9.5 Counterparty risk by type of position
|
Risk exposure |
||
|---|---|---|
|
Amounts in NOK million |
30.06.2026 |
31.12.2025 |
|
Derivatives including foreign exchange contracts |
143,358 |
134,734 |
|
Securities lending |
139,094 |
120,786 |
|
Unsecured bank deposits1 |
35,469 |
29,176 |
|
Repurchase and reverse repurchase agreements |
11,302 |
11,754 |
|
Prime brokerage |
16,406 |
6,409 |
|
Settlement risk towards brokers and long-settlement transactions |
12,779 |
7,443 |
|
Total |
358,408 |
310,301 |
1 The amount also includes bank deposits in non-consolidated subsidiaries.
Total counterparty risk exposure increased to NOK 358.4 billion at the end of the first half, from NOK 310.3 billion at the end of 2025. There was an increase in all types of positions during the period, apart from repurchase and reverse repurchase agreements, which fell marginally. The largest changes in risk exposure came from securities lending, prime brokerage and derivatives including foreign exchange contracts. Risk exposure from securities lending increased by 15.2 percent to NOK 139.1 billion, and accounted for 38.8 percent of total exposure at the end of the first half. Prime brokerage activity increased in the first half, and risk exposure increased correspondingly by NOK 10.0 billion, to NOK 16.4 billion at the end of the first half. Risk exposure from derivatives including foreign exchange contracts increased by 6.4 percent during the period, to NOK 143.4 billion at the end of the first half. Derivatives including foreign exchange contracts accounted for 40.0 percent of total risk exposure at the end of the first half, of which 29.2 percent of this exposure was towards central counterparties.
Note 10 Foreign exchange gains and losses
Gains and losses on financial instruments are due to changes in the price of the instrument (security element) and changes in foreign exchange rates (foreign exchange element). These are presented separately in the income statement. See note 11 Foreign exchange gains and losses in the 2025 annual report for further information.
The fund’s market value in Norwegian kroner is affected by changes in foreign exchange rates. See table 9.1 in note 9 Investment risk for an overview of the market value of the investment portfolio by asset class, country and currency. The change in the fund’s market value due to changes in foreign exchange rates is presented in table 10.1.
Table 10.1 Specification foreign exchange gain/loss
|
Amounts in NOK million |
1H 2026 |
1H 2025 |
2025 |
|---|---|---|---|
|
Foreign exchange gain/loss - USD/NOK |
-132,610 |
-858,235 |
-883,982 |
|
Foreign exchange gain/loss - EUR/NOK |
-132,053 |
28,481 |
21,126 |
|
Foreign exchange gain/loss - GBP/NOK |
-27,439 |
-22,690 |
-40,526 |
|
Foreign exchange gain/loss - JPY/NOK |
-46,290 |
-29,074 |
-103,818 |
|
Foreign exchange gain/loss - CHF/NOK |
-13,177 |
5,300 |
6,027 |
|
Foreign exchange gain/loss - other |
-75,170 |
-134,084 |
-154,124 |
|
Foreign exchange gain/loss |
-426,740 |
-1,010,301 |
-1,155,299 |
Note 11 Management costs
Management costs comprise all costs relating to the management of the investment portfolio. These are mainly incurred in Norges Bank, but management costs are also incurred in subsidiaries of Norges Bank that are exclusively established as part of the management of the GPFG’s investments in unlisted real estate and unlisted renewable energy infrastructure.
Management costs in Norges Bank
The Ministry of Finance reimburses Norges Bank for costs incurred in connection with the management of the GPFG, in the form of a management fee. The management fee is equivalent to the actual costs incurred in Norges Bank, including performance-based fees to external managers, and is expensed in the GPFG’s profit or loss for the period on the line Management fee. Costs included in the management fee are specified in table 11.1.
Table 11.1 Management fee
|
1H 2026 |
1H 2025 |
2025 |
||||
|---|---|---|---|---|---|---|
|
Amounts in NOK million |
Basis points |
Basis points |
Basispunkter |
|||
|
Salary, social security and other personnel-related costs |
1,169 |
1,132 |
2,476 |
|||
|
Custody costs |
231 |
216 |
447 |
|||
|
IT services, systems, data and information |
430 |
428 |
858 |
|||
|
Research, consulting and legal fees |
137 |
133 |
287 |
|||
|
Other costs |
130 |
148 |
274 |
|||
|
Allocated costs Norges Bank |
118 |
118 |
257 |
|||
|
Base fees to external managers |
1,224 |
1,059 |
1,756 |
|||
|
Management fee excluding performance-based fees |
3,440 |
3.1 |
3,234 |
3.1 |
6,355 |
3.2 |
|
Performance-based fees to external managers |
1,390 |
765 |
1,182 |
|||
|
Management fee |
4,830 |
4.2 |
3,999 |
4.2 |
7,537 |
3.8 |
Management costs in subsidiaries
Management costs incurred in wholly owned subsidiaries consist of costs related to the management of the fund’s investments in unlisted real estate and unlisted renewable energy infrastructure. These costs are expensed directly in the portfolio result and are not part of the management fee.
Management costs incurred in non-consolidated subsidiaries are included in the lines Income/expense from unlisted real estate and Income/expense from unlisted infrastructure in the income statement. Management costs incurred in consolidated subsidiaries are presented in the income statement under Other income/expense. These costs are specified in table 11.2.
Table 11.2 Management costs subsidiaries
|
1H 2026 |
1H 2025 |
2025 |
||||
|---|---|---|---|---|---|---|
|
Amounts in NOK million |
Basis points |
Basis points |
Basis points |
|||
|
Salary, social security and other personnel-related costs |
20 |
27 |
48 |
|||
|
IT services, systems, data and information |
2 |
4 |
7 |
|||
|
Research, consulting and legal fees |
52 |
48 |
90 |
|||
|
Other costs |
60 |
32 |
99 |
|||
|
Total management costs subsidiaries1 |
135 |
0.1 |
110 |
0.1 |
244 |
0.1 |
|
Of which management costs non-consolidated subsidiaries |
93 |
68 |
157 |
|||
|
Of which management costs consolidated subsidiaries |
42 |
43 |
87 |
|||
1 The amount for the first half of 2026 consists of NOK 95 million related to investments in unlisted real estate and NOK 40 million related to investments in unlisted infrastructure. In the first half of 2025, NOK 101 million was related to investments in unlisted real estate and NOK 9 million to investments in unlisted infrastructure.
Upper limit for reimbursement of management costs
Every year the Ministry of Finance establishes an upper limit for the reimbursement of management costs. Norges Bank is only reimbursed for costs incurred within this limit. Norges Bank is also reimbursed for performance-based fees to external managers. These fees are not measured against the upper limit.
The sum of management costs incurred in Norges Bank and in subsidiaries, excluding performance-based fees to external managers, is limited to NOK 8,100 million for 2026. For 2025, the limit was NOK 8,100 million.
At the end of the first half, total management costs measured against the upper cost limit amounted to NOK 3,575 million. Of this, management costs in Norges Bank, excluding performance-based fees to external managers, accounted for NOK 3,440 million and management costs in subsidiaries NOK 135 million. Total management costs, including performance-based fees to external managers, amounted to NOK 4,965 million.
Costs measured as a share of assets under management
Annualised costs are also measured in basis points, as a share of average assets under management. Average assets under management are calculated based on the market value of the investment portfolio in Norwegian kroner at the start of each month in the calendar year.
At the end of the first half, the sum of management costs incurred in Norges Bank and in subsidiaries, excluding performance-based fees to external managers, corresponded to 3.2 basis points of assets under management. Management costs including performance-based fees to external managers corresponded to 4.3 basis points of assets under management.
Other operating costs in subsidiaries
In addition to the management costs presented in table 11.2, other operating costs are also incurred in subsidiaries related to the ongoing maintenance, operation and development of the investments. These are not costs related to investing in real estate or renewable energy infrastructure but are costs for operating the underlying investments once they are acquired. Therefore, they are not defined as management costs. These costs are expensed directly in the portfolio result and are not part of the management fee. They are also not included in the costs measured against the upper cost limit.
Other operating costs incurred in non-consolidated subsidiaries are presented in the income statement as Income/expense from unlisted real estate and Income/expense from unlisted infrastructure. For further information, see table 6.4 in note 6 Unlisted real estate and table 7.4 in note 7 Unlisted renewable energy infrastructure. Other costs incurred in consolidated subsidiaries are presented in the income statement as Other income/expense.
Auditor’s report
To the Supervisory Council of Norges Bank
Report on review of interim financial information
Introduction
We have reviewed the accompanying condensed balance sheet of the Government Pension Fund Global as at 30 June 2026 and the related condensed income statement, statement of changes in owner’s capital and statement of cash flows for the period from 1 January 2026 to 30 June 2026. The Executive Board and management are responsible for the preparation and presentation of these interim financial statements in accordance with International Accounting Standard (IAS) 34 Interim Financial Reporting as adopted by the EU. Our responsibility is to express a conclusion on these interim financial statements based on our review.
Scope of review
We conducted our review in accordance with the International Standard on Review Engagements 2410 Review of Interim Financial Information Performed by the Independent Auditor of the Entity. A review of interim financial information consists of making inquiries, primarily of persons responsible for financial and accounting matters, and applying analytical and other review procedures. A review is substantially less in scope than an audit conducted in accordance with International Standards on Auditing (ISAs) and consequently does not enable us to obtain assurance that we would become aware of all significant matters that might be identified in an audit. Accordingly, we do not express an audit opinion.
Conclusion
Based on our review, nothing has come to our attention that causes us to believe that the accompanying interim financial information is not prepared, in all material respects, in accordance with International Accounting Standard (IAS) 34 Interim Financial Reporting as adopted by the EU.
Oslo, 10 August 2026
Ernst & Young AS
Kjetil Rimstad
State Authorised Public Accountant
This translation from Norwegian has been prepared for information purposes only.