1. Investments
The fund’s market value increased 2,870 billion kroner to 15,299 billion kroner in the first half of 2023, driven by a strong equity market and a weaker krone. The fund’s return for the period was 10.0 percent, or 1,501 billion kroner, which is 0.23 percentage point less than the return on the benchmark index.

Equity investments had a market value of 10,901 billion at the end of the period, fixed-income investments 4,037 billion kroner, unlisted real estate investments 345 billion kroner and unlisted renewable energy infrastructure investments 16 billion kroner. Equities made up 71.3 percent of the value of the fund, fixed income 26.4 percent, unlisted real estate 2.3 percent and unlisted renewable energy infrastructure 0.1 percent.
The change in the fund’s market value consists of the return of 1,501 billion kroner, transfers from the government of 389 billion kroner, and 980 billion kroner from the weaker krone.
The fund is invested in international securities and unlisted real estate and infrastructure in foreign currency. Returns are therefore measured primarily in international currency – a weighted combination of the currencies in the fund’s benchmark indices for equities and bonds. Unless otherwise stated, the results in this report are measured in this currency basket.
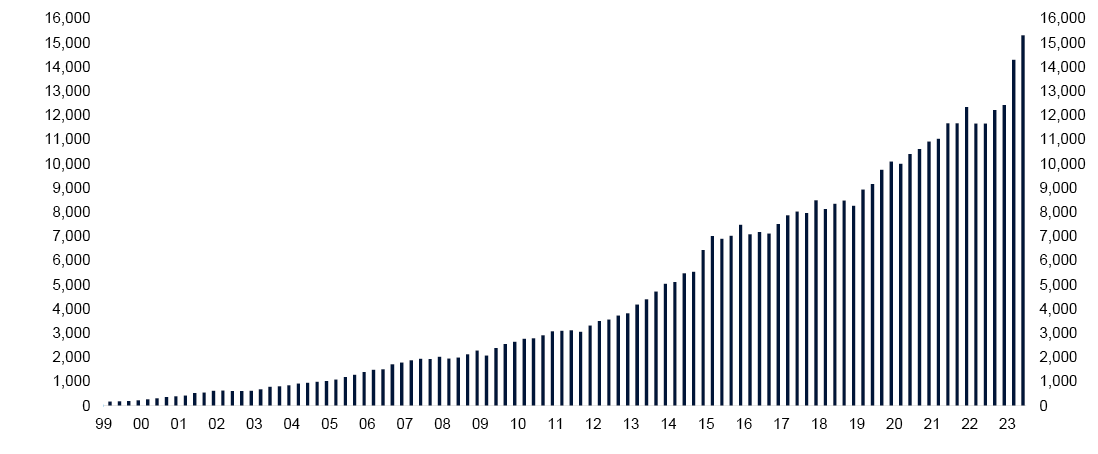
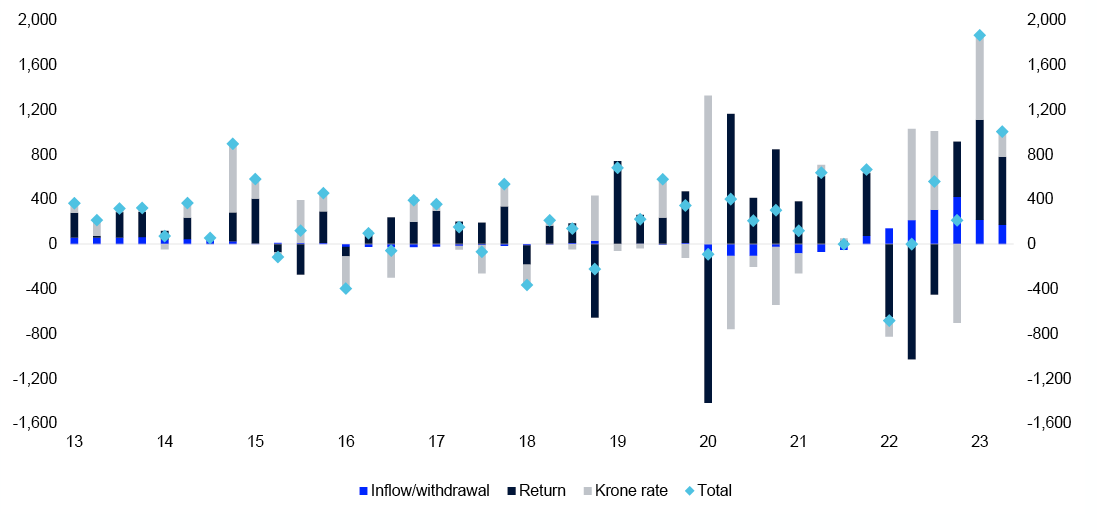
Table 1Key figures in billions of kroner.
|
First half 2023 |
1Q 2023 |
2022 |
|
|---|---|---|---|
|
Market value |
|||
|
Equity investments |
10,901 |
10,023 |
8,672 |
|
Fixed-income investments |
4,037 |
3,909 |
3,412 |
|
Unlisted real estate investments |
345 |
348 |
330 |
|
Unlisted infrastructure investments |
16 |
14 |
15 |
|
Market value of fund1 |
15,299 |
14,294 |
12,429 |
|
Accrued, not paid, management fees2 |
0 |
-2 |
0 |
|
Owner's capital1 |
15,300 |
14,292 |
12,429 |
|
Inflow of capital |
392 |
217 |
1,090 |
|
Withdrawal of capital |
- |
- |
- |
|
Paid management fees3 |
-3 |
0 |
-5 |
|
Return on fund |
1,501 |
893 |
-1,637 |
|
Changes due to fluctuations in krone |
980 |
755 |
642 |
|
Total change in market value |
2,870 |
1,865 |
90 |
|
Changes in value since first capital inflow in 1996 |
|||
|
Total inflow of capital |
5,136 |
4,961 |
4,744 |
|
Total withdrawal of capital2 |
-687 |
-685 |
-687 |
|
Return on equity investments |
6,755 |
6,104 |
5,280 |
|
Return on fixed-income investments |
1,018 |
1,044 |
970 |
|
Return on unlisted real estate investments |
98 |
114 |
119 |
|
Return on unlisted infrastructure investments |
1 |
1 |
2 |
|
Management fees3 |
-67 |
-65 |
-63 |
|
Changes due to fluctuations in krone |
3,046 |
2,820 |
2,065 |
|
Market value of fund |
15,299 |
14,294 |
12,429 |
|
Return on fund |
7,871 |
7,263 |
6,370 |
|
Return after management costs |
7,805 |
7,198 |
6,307 |
1 The fund’s market value shown in this table does not take into account the management fee. Owner’s capital in the financial statements equals the fund’s market value less accrued, not paid, management fees.
2 Total withdrawal of capital shown in this table is adjusted for accrued, not paid, management fees.
3 Management fees are describe in note 11 in the financial statements.
Table 2 Return figures in percent. Measured in the fund's currency basket.
|
First half 2023 |
2Q 2023 |
1Q 2023 |
|
|---|---|---|---|
|
Equity investments |
13.66 |
5.79 |
7.44 |
|
Fixed-income investments |
2.25 |
-0.47 |
2.73 |
|
Unlisted real estate investments |
-4.57 |
-3.59 |
-1.01 |
|
Unlisted infrastructure investments |
-6.53 |
-2.87 |
-3.77 |
|
Return on fund |
10.00 |
3.85 |
5.92 |
|
Management costs |
0.02 |
0.01 |
0.01 |
|
Return on fund after management costs |
9.97 |
3.83 |
5.91 |
Table 3 Historical key figures in percent as at 30 June 2023. Annualised data, measured in the fund's currency basket.
|
Since 01.01.1998 |
Last 10 years |
Last 12 months |
|
|---|---|---|---|
|
Fund return |
5.99 |
7.14 |
10.38 |
|
Annual price inflation |
2.11 |
2.40 |
3.87 |
|
Annual management costs |
0.08 |
0.05 |
0.04 |
|
Net real return on fund |
3.72 |
4.58 |
6.23 |
|
The fund's actual standard deviation |
8.37 |
9.35 |
13.58 |
Return on equity investments
The fund’s equity investments had a strong first half after a weak 2022. Equity investments returned 13.7 percent for the period. The strongest returns were in technology, consumer discretionary and industrials. Energy had the weakest return.
Tech stocks perform best
Technology companies delivered the period’s strongest return of 38.6 percent after a poor year in 2022. The sector benefited from strong demand for new AI solutions from the biggest internet and software companies and their semiconductor suppliers.
Consumer discretionary was the second-strongest sector with a return of 20.7 percent. Consumption and economic activity held up despite higher prices and higher interest rates, and the lifting of pandemic restrictions in China led to further optimism, especially among luxury goods companies.
Industrials were the third-strongest sector with a return of 15.0 percent. Further strong growth in orders and increased demand outweighed fears of recession. Prices held up and costs slowed, leading in many cases to very high margins and strong earnings.
Energy companies returned 0.4 percent. Prices for oil, gas and refined products fell back from the very high levels of 2022. The oil market was hit by excess supply, while gas prices dropped as a result of a mild winter, lower industrial demand and so higher stock levels.
Table 4 Return on the fund's equity investments in first half of 2023. In percent. Measured in international currency.
|
Market |
Return |
Share of equity investments |
|---|---|---|
|
North America |
17.3 |
48.6 |
|
Europe |
13.3 |
28.4 |
|
Asia and Oceania |
6.4 |
20.4 |
|
Emerging markets |
5.1 |
10.2 |
Table 5 Return on the fund's equity investments in first half of 2023. In percent. Measured in international currency and sorted by sector.
|
Sector |
Return |
Share of equity investments1 |
|---|---|---|
|
Basic Materials |
4.1 |
4.0 |
|
Consumer Staples |
3.7 |
6.1 |
|
Consumer Discretionary |
20.7 |
14.2 |
|
Financials |
5.6 |
14.3 |
|
Health Care |
2.8 |
11.8 |
|
Industrials |
15.0 |
13.1 |
|
Energy |
0.4 |
3.9 |
|
Technology |
38.6 |
21.2 |
|
Telecommunications |
5.4 |
3.3 |
|
Utilities |
5.6 |
2.5 |
|
Real Estate |
1.0 |
4.9 |
1 Does not sum up to 100 percent because cash and derivatives are not included.
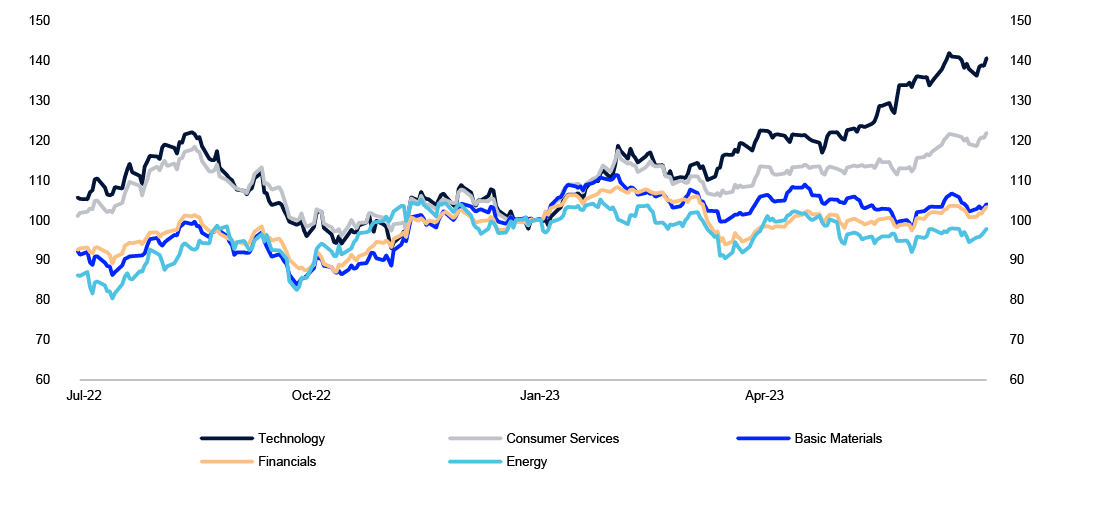
Table 6 The fund's largest equity holdings as at 30 June 2023 in millions of kroner.
|
Company |
Country |
Holding |
|---|---|---|
|
Apple Inc |
US |
358,871 |
|
Microsoft Corp |
US |
332,607 |
|
Alphabet Inc |
US |
174,063 |
|
Amazon.com Inc |
US |
152,257 |
|
NVIDIA Corp |
US |
131,730 |
|
Nestle SA |
Switzerland |
100,258 |
|
Meta Platforms Inc |
US |
99,940 |
|
Taiwan Semiconductor Manufacturing Co Ltd |
Taiwan |
84,753 |
|
ASML Holding NV |
Netherlands |
84,696 |
|
Tesla Inc |
US |
80,038 |
|
Novo Nordisk A/S |
Denmark |
74,191 |
|
Shell PLC |
UK |
69,285 |
|
Berkshire Hathaway Inc |
US |
67,685 |
|
Roche Holding AG |
Switzerland |
65,295 |
|
Samsung Electronics Co Ltd |
South Korea |
63,312 |
|
LVMH Moet Hennessy Louis Vuitton SE |
France |
59,129 |
|
Novartis AG |
Switzerland |
58,074 |
|
Exxon Mobil Corp |
US |
57,086 |
|
AstraZeneca PLC |
UK |
55,333 |
|
JPMorgan Chase & Co |
US |
53,937 |
Return on fixed-income investments
Fixed-income investments returned 2.2 percent for the first half of the year. Inflation has fallen in our main markets. Central banks continued to tighten monetary policy in most markets where the fund is invested. This had little impact on long-term interest rates, resulting in an inverted yield curve – higher interest rates for short-term loans than for long-term loans. This meant that the market value of our bond investments held up.
Higher policy rates
Government bonds returned 1.1 percent for the first half and accounted for 55.6 percent of the fund’s fixed-income investments at the end of the period. The fund’s three largest holdings were of US, Japanese and German government bonds.
US Treasuries accounted for 24.7 percent of fixed-income investments and returned 1.4 percent. The Federal Reserve raised its policy rate by 0.75 percentage point in the first half of the year while signalling further increases in the second half of the year.
Euro-denominated government bonds amounted to 11.7 percent of fixed-income investments and returned 4.7 percent. The European Central Bank raised its policy rate by a total of 1.5 percentage points in the first half of the year. The euro strengthened during the period.
Japanese government bonds made up 8.5 percent of fixed-income investments and returned -6.8 percent. The Bank of Japan did not change its policy rate during the period. The weak return was down to a weaker yen.
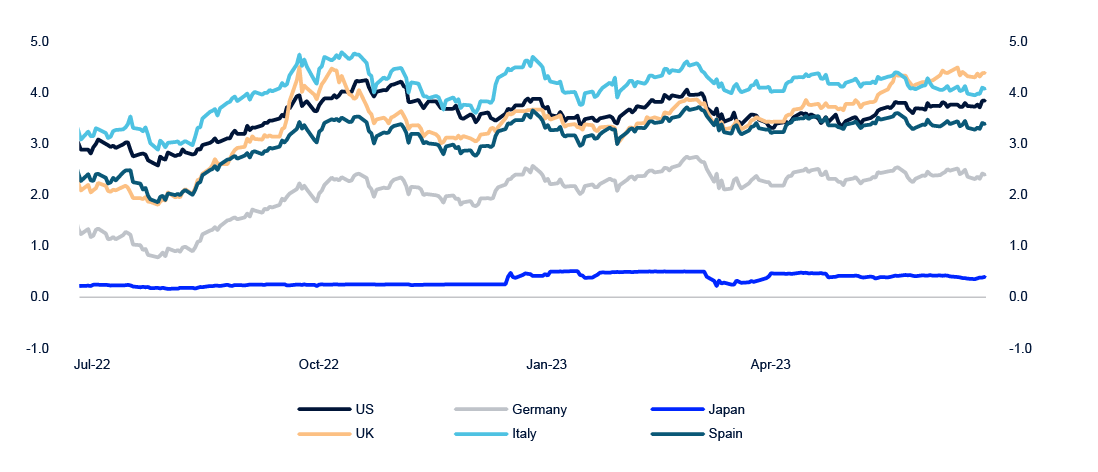
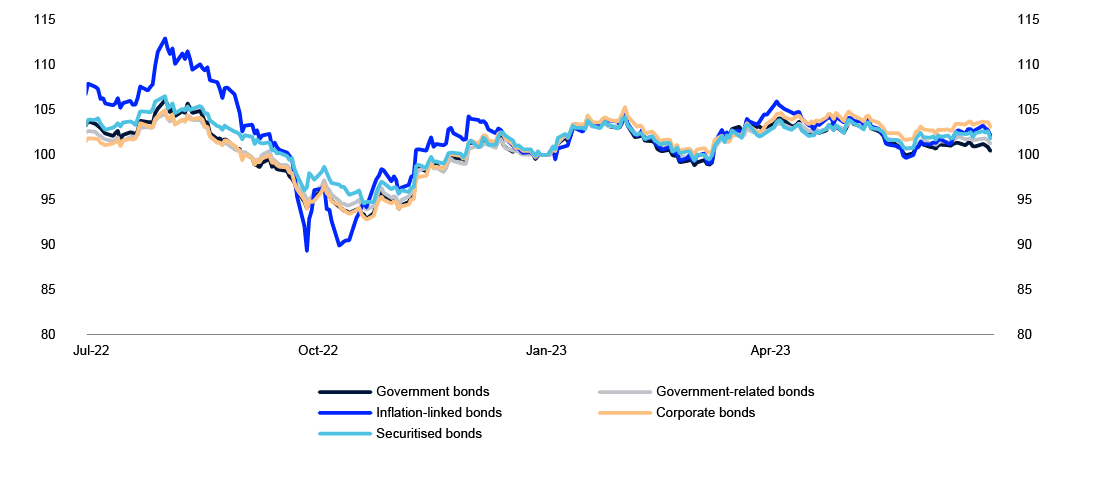
Table 7 Return on the fund's fixed-income investments in the first half of 2023. In percent. Measured in international currency and sorted by sector.
|
Sector |
Return |
Share of fixed-income investments1 |
|---|---|---|
|
Government bonds2 |
1.1 |
55.6 |
|
Government-related bonds2 |
3.1 |
10.5 |
|
Inflation-linked bonds2 |
2.0 |
7.0 |
|
Corporate bonds |
3.5 |
24.4 |
|
Securitised bonds |
2.9 |
7.0 |
1 Does not sum up to 100 percent because cash and derivatives are not included.
2 Governments may issue different types of bonds, and the fund's investments in these bonds are grouped accordingly. Bonds issued by a country's government in the country's own currency are categorised as government bonds. Bonds issued by a country's government in another country's currency are government-related bonds. Inflation-linked bonds issued by governments are grouped with inflation linked bonds.
Table 8 The fund's largest bond holdings as at 30 June 2023 in millions of kroner.
|
Issuer |
Country |
Holding |
|---|---|---|
|
Government of United States of America |
US |
1,117,091 |
|
Government of Japan |
Japan |
358,321 |
|
Government of Germany |
Germany |
187,667 |
|
United Kingdom Government |
UK |
134,296 |
|
Government of France |
France |
117,024 |
|
Government of Canada |
Canada |
99,598 |
|
Monetary Authority of Singapore |
Singapore |
88,582 |
|
Government of Italy |
Italy |
60,800 |
|
European Union |
International organisations |
51,801 |
|
Government of the Netherlands |
Netherlands |
48,284 |
|
Canada Mortgage & Housing Corp |
Canada |
45,306 |
|
Government of Australia |
Australia |
42,404 |
|
Bank of America Corp |
US |
33,695 |
|
Government of Spain |
Spain |
27,124 |
|
Government of Austria |
Austria |
26,020 |
|
Government of Singapore |
Singapore |
21,715 |
|
European Financial Stability Facility |
International organisations |
21,172 |
|
JPMorgan Chase & Co |
US |
20,483 |
|
Morgan Stanley |
US |
19,673 |
|
Government of Belgium |
Belgium |
18,371 |
Return on real estate investments
Total real estate investments returned -2.0 percent for the first half and amounted to 3.9 percent of the fund at the end of the period. Unlisted and listed real estate investments are managed under a combined strategy for real estate.
Unlisted real estate investments made up 58.4 percent of the overall real estate portfolio and returned -4.6 percent, while investments in listed real estate returned 1.7 percent.
The main driver behind the negative return on unlisted real estate was the office sector, with US investments in particular falling sharply in value during the period. This was due mainly to increased vacancy, which means reduced income for investors. The return on the listed portfolio was also affected by the negative performance in the US office sector.
Table 9 Value of real estate investments in millions of kroner as at 30 June 2023.
|
Value1 |
|
|---|---|
|
Unlisted real estate investments |
344,529 |
|
Listed real estate investments |
245,881 |
|
Total real estate investments |
590,410 |
1 Including bank deposits and other receivables.
Table 10 Return on unlisted real estate investments in the first half of 2023. In percentage points.
|
Return |
|
|---|---|
|
Rental income |
1.6 |
|
Changes in value |
-7.3 |
|
Transaction costs |
-0.1 |
|
Result of currency adjustments |
1.3 |
|
Total |
-4.6 |
Return on unlisted renewable energy infrastructure investments
Investments in unlisted renewable energy infrastructure returned -6.5 percent for the first half of the year, due mainly to lower expected power prices.
The fund made two new investments during the period. In January, we signed an agreement to acquire a 49 percent interest in a portfolio of solar and onshore wind assets in Spain for 600 million euros, or around 6.4 billion kroner. In March, we signed an agreement to purchase a 16.6 percent stake in He Dreiht, a 960 MW offshore wind project under construction in Germany, for 430 million euros, or around 4.9 billion kroner.
Table 11 Value of unlisted renewable energy infrastructure investments in millions of kroner as at 30 June 2023.
|
Value1 |
|
|---|---|
|
Unlisted infrastructure investments |
16,353 |
1 Including bank deposits and other receivables.
Table 12 Return of unlisted renewable energy infrastructure investments in the first half of 2023. In percent.
|
Return |
|
|---|---|
|
Unlisted infrastructure investments |
-6.5 |
The fund’s relative return
The return on the fund for the first half of the year was 0.23 percentage point less than the return on the benchmark index from the Ministry of Finance, corresponding to a relative return of -33 billion kroner. We break the relative return down between equity, fixed-income and real asset management, and an allocation effect between them.
Investments in unlisted real estate and renewable energy infrastructure made the most negative contribution to the fund’s relative return for the period, measured against the equities and bonds sold to finance these investments. Unlisted real estate investments contributed -0.26 percentage point, driven primarily by investments in the US office sector. Listed real estate investments contributed -0.07 percentage point, and investments in renewable energy infrastructure also made a slightly negative contribution.
Equity management made a positive contribution of 0.13 percentage point to the fund’s relative return for the period. Investments in technology and financials made the most positive contributions, while consumer discretionary made the most negative.
Fixed-income management contributed 0.06 percentage point to the relative return for the period. The fund’s fixed-income investments include an allocation to emerging markets, which made a positive contribution to the relative return.
The relative return may also be affected by an allocation effect between these management areas. The contribution from this effect during the period was -0.08 percentage point, as the fund was underweight in equities relative to bonds.
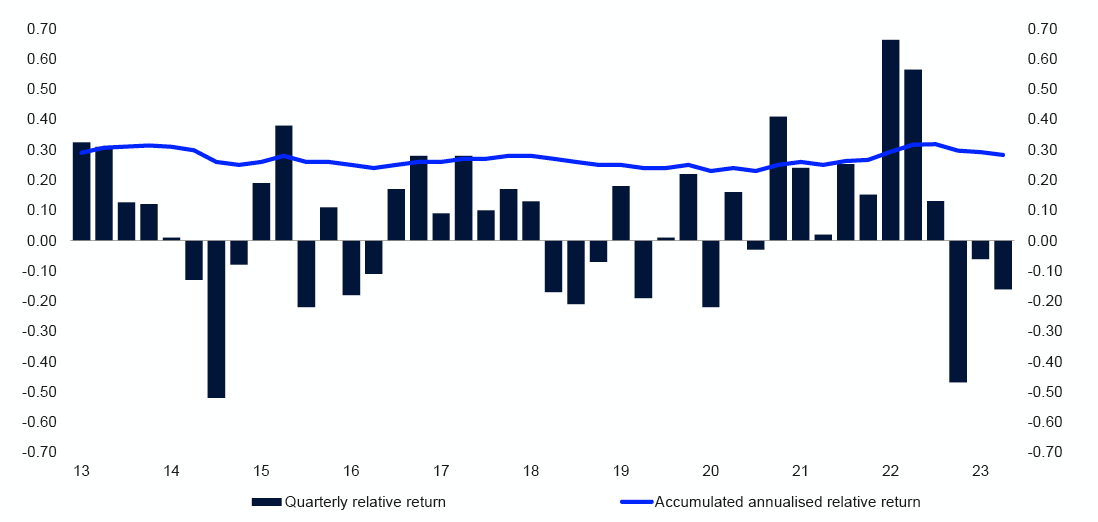
Table 13 Historic relative return in percentage points as at 30 June 2023. Annualised figures measured in the fund's currency basket.
|
|
Since 01.01.1998 |
Last 15 years |
Last 10 years |
Last 5 years |
Last 12 months |
|---|---|---|---|---|---|
|
Relative return on fund (percentage points)1 |
0.28 |
0.26 |
0.25 |
0.34 |
-0.58 |
|
The fund's tracking error (percentage points)1 |
0.65 |
0.74 |
0.41 |
0.46 |
0.59 |
|
The fund's information ratio (IR)1,2 |
0.45 |
0.36 |
0.56 |
0.69 |
-0.99 |
1 Based on aggregated equity and fixed-income investments until end of 2016.
2 The fund's information ratio (IR) is the ratio of the fund's average monthly relative return to the fund's tracking error. The IR indicates how much relative return has been achieved per unit of relative risk.
Table 14 Contributions from management areas to the fund's relative return in percentage points in the first half of 2023.
|
Total |
|
|---|---|
|
Equity management |
0.13 |
|
Fixed-income management |
0.06 |
|
Real assets management |
-0.34 |
|
Allocation effect |
-0.08 |
|
Total |
-0.23 |
Investment framework
The fund is managed on the basis of limits set in the mandate from the Ministry of Finance.
Table 15 Key figures for the fund's risk and exposure.
|
Limits set by the Ministry of Finance |
30.06.2023 |
|
|---|---|---|
|
Allocation |
Equity portfolio 60–80 percent of fund's market value1 |
71.1 |
|
Unlisted real estate no more than 7 percent of the fund's market value |
2.3 |
|
|
Fixed-income portfolio 20–40 percent of fund's market value1 |
27.1 |
|
|
Unlisted renewable energy infrastructure no more than 2 percent of the fund's market value |
0.1 |
|
|
Market risk |
1.25 percentage points expected relative volatility for the fund's investments |
0.4 |
|
Credit risk |
Maximum 5 percent of fixed-income investments may be rated below BBB- |
1.1 |
|
Emerging markets |
Maximum 5 percent of fixed-income investments may be in emerging markets |
3.0 |
|
Ownership |
Maximum 10 percent of voting shares in a listed company in the equity portfolio2 |
9.6 |
1 Derivatives are represented with their underlying economic exposure.
2 Investments in listed and unlisted real estate companies are exempt from this restriction.
Operational risk management
Norges Bank’s Executive Board has decided there must be less than a 20 percent probability that operational risk factors will have a financial impact of 750 million kroner or more over a 12-month period.
Estimated operational risk exposure remained within the Executive Board’s tolerance limit in the first half of the year. A total of 81 unwanted operational events were registered, with an estimated financial impact of around 1.1 billion kroner. Most of this financial impact was due to a minor error that was discovered in our calculation of the currency allocation in the government bond portion of the Ministry of Finance’s benchmark index for the bond portfolio as a result of the wrong data being used.
Responsible investment
The first half of the year is the busy season for voting, with more than two thirds of companies’ annual shareholder meetings taking place between April and June. Voting is one of the most important instruments available to us for exercising our ownership rights. We voted on a total of 94,731 proposals at 8,522 shareholder meetings in the first half. All of our voting is continuously updated on www.nbim.no. In addition to a separate review on how we voted during the period and information on how our voting works in practice.
We had 1,675 meetings with companies in the first half of the year, raising governance and sustainability issues at 63.6 percent of them. These issues mostly concerned capital management, climate change and human capital.
2. Financial statements
|
Amounts in NOK million |
Note |
1H 2023 |
1H 2022 |
2022 |
|---|---|---|---|---|
|
Profit/loss on the portfolio before foreign exchange gain/loss |
||||
|
Income/expense from: |
||||
|
- Equities |
4 |
1 470 655 |
-1 383 671 |
-1 201 835 |
|
- Bonds |
4 |
53 550 |
-339 903 |
-453 128 |
|
- Unlisted real estate |
6 |
-20 834 |
21 732 |
-2 213 |
|
- Unlisted infrastructure |
7 |
-1 769 |
-1 162 |
897 |
|
- Financial derivatives |
4 |
8 177 |
21 271 |
23 926 |
|
- Secured lending |
4 193 |
2 008 |
4 845 |
|
|
- Secured borrowing |
-5 808 |
-101 |
-4 792 |
|
|
Tax expense |
-6 742 |
-563 |
-4 850 |
|
|
Interest income/expense |
-87 |
4 |
-22 |
|
|
Other income/expense |
11 |
-13 |
-4 |
|
|
Profit/loss on the portfolio before foreign exchange gain/loss |
1 501 345 |
-1 680 400 |
-1 637 176 |
|
|
Foreign exchange gain/loss |
10 |
980 432 |
642 339 |
641 850 |
|
Profit/loss on the portfolio |
2 481 777 |
-1 038 061 |
-995 326 |
|
|
Management fee |
11 |
-3 502 |
-2 780 |
-5 226 |
|
Profit/loss and total comprehensive income |
2 478 274 |
-1 040 841 |
-1 000 551 |
|
Amounts in NOK million |
Note |
30.06.2023 |
31.12.2022 |
|---|---|---|---|
|
Assets |
|||
|
Deposits in banks |
13 433 |
12 061 |
|
|
Secured lending |
365 427 |
462 982 |
|
|
Cash collateral posted |
3 857 |
21 601 |
|
|
Unsettled trades |
113 090 |
11 428 |
|
|
Equities |
5 |
10 355 651 |
8 138 602 |
|
Equities lent |
5 |
482 329 |
451 799 |
|
Bonds |
5 |
3 823 460 |
2 968 272 |
|
Bonds lent |
5 |
393 327 |
886 555 |
|
Financial derivatives |
5 |
25 899 |
20 498 |
|
Unlisted real estate |
6 |
343 711 |
329 732 |
|
Unlisted infrastructure |
7 |
15 717 |
14 489 |
|
Withholding tax receivable |
10 493 |
8 937 |
|
|
Other assets |
3 688 |
2 017 |
|
|
Management fee receivable |
198 |
274 |
|
|
Total assets |
15 950 281 |
13 329 248 |
|
|
Liabilities and owner's capital |
|||
|
Secured borrowing |
480 355 |
796 082 |
|
|
Cash collateral received |
22 109 |
14 801 |
|
|
Unsettled trades |
119 860 |
44 329 |
|
|
Financial derivatives |
5 |
22 717 |
40 159 |
|
Deferred tax |
5 519 |
4 488 |
|
|
Other liabilities |
113 |
56 |
|
|
Total liabilities |
650 673 |
899 915 |
|
|
Owner's capital |
15 299 608 |
12 429 334 |
|
|
Total liabilities and owner's capital |
15 950 281 |
13 329 248 |
|
Amounts in NOK million, receipt (+) / payment (-) |
Note |
1H 2023 |
1H 2022 |
2022 |
|---|---|---|---|---|
|
Operating activities |
||||
|
Receipts of dividend from equities |
135 671 |
103 720 |
190 235 |
|
|
Receipts of interest from bonds |
41 148 |
24 789 |
55 724 |
|
|
Receipts of interest and dividend from unlisted real estate |
6 |
3 367 |
2 969 |
6 156 |
|
Receipts of interest and dividend from unlisted infrastructure |
7 |
457 |
96 |
162 |
|
Net receipts of interest and fee from secured lending and borrowing |
-3 029 |
1 939 |
1 521 |
|
|
Receipts of dividend, interest and fee from holdings of equities, bonds, unlisted real estate and unlisted infrastructure |
177 614 |
133 513 |
253 797 |
|
|
Net cash flow from purchase and sale of equities |
-318 659 |
-157 205 |
-719 766 |
|
|
Net cash flow from purchase and sale of bonds |
37 690 |
-157 636 |
-702 877 |
|
|
Net cash flow to/from investments in unlisted real estate |
6 |
-4 382 |
2 148 |
-3 930 |
|
Net cash flow to/from investments in unlisted infrastructure |
7 |
-1 923 |
373 |
1 143 |
|
Net cash flow financial derivatives |
-13 468 |
27 844 |
52 485 |
|
|
Net cash flow cash collateral related to derivative transactions |
22 905 |
7 052 |
-16 013 |
|
|
Net cash flow secured lending and borrowing |
-274 653 |
-192 642 |
52 860 |
|
|
Net payment of taxes |
-7 261 |
-8 281 |
-11 058 |
|
|
Net cash flow related to interest on deposits in banks and bank overdraft |
55 |
-5 |
30 |
|
|
Net cash flow related to other income/expense, other assets and other liabilities |
1 298 |
254 |
478 |
|
|
Management fee paid to Norges Bank1 |
-3 426 |
-2 264 |
-4 964 |
|
|
Net cash inflow/outflow from operating activities |
-384 210 |
-346 849 |
-1 097 816 |
|
|
Financing activities |
||||
|
Inflow from the Norwegian government |
390 427 |
355 942 |
1 089 712 |
|
|
Withdrawal by the Norwegian government |
- |
- |
- |
|
|
Net cash inflow/outflow from financing activities |
390 427 |
355 942 |
1 089 712 |
|
|
Net change deposits in banks |
||||
|
Deposits in banks at 1 January |
12 061 |
18 450 |
18 450 |
|
|
Net increase/decrease of cash in the period |
6 216 |
9 094 |
-8 104 |
|
|
Net foreign exchange gain/loss on cash |
-4 844 |
4 591 |
1 715 |
|
|
Deposits in banks at end of period |
13 433 |
32 134 |
12 061 |
1 Management fee in the statement of cash flows consists of transfers to/from the krone account in connection with the settlement of management costs incurred in Norges Bank.
|
Amounts in NOK million |
Inflows from owner |
Retained earnings |
Total owner's capital |
|---|---|---|---|
|
1 January 2022 |
2 967 570 |
9 372 515 |
12 340 085 |
|
Profit/loss and total comprehensive income |
- |
-1 040 841 |
-1 040 841 |
|
Inflow during the period |
358 000 |
- |
358 000 |
|
Withdrawal during the period |
- |
- |
- |
|
30 June 2022 |
3 325 570 |
8 331 674 |
11 657 245 |
|
1 July 2022 |
3 325 570 |
8 331 674 |
11 657 245 |
|
Profit/loss and total comprehensive income |
- |
40 290 |
40 290 |
|
Inflow during the period |
731 800 |
- |
731 800 |
|
Withdrawal during the period |
- |
- |
- |
|
31 December 2022 |
4 057 370 |
8 371 964 |
12 429 334 |
|
1 January 2023 |
4 057 370 |
8 371 964 |
12 429 334 |
|
Profit/loss and total comprehensive income |
- |
2 478 274 |
2 478 274 |
|
Inflow during the period |
392 000 |
- |
392 000 |
|
Withdrawal during the period |
- |
- |
- |
|
30 June 2023 |
4 449 370 |
10 850 238 |
15 299 608 |
Notes
Note 1 General information
Introduction
Norges Bank is Norway’s central bank. The bank is a separate legal entity and is owned by the state. Norges bank manages the Government Pension Fund Global (GPFG) on behalf of the Ministry of Finance, in accordance with section 3, second paragraph of the Government Pension Fund Act and the management mandate for the GPFG, issued by the Ministry of Finance.
The GPFG shall support government saving to finance future expenditure and underpin long-term considerations relating to the use of Norway’s petroleum revenues. The Norwegian Parliament has established the legal framework in the Government Pension Fund Act, and the Ministry of Finance has formal responsibility for the fund’s management. The Executive Board of Norges Bank has delegated day-to-day management of the GPFG to Norges Bank Investment Management (NBIM).
The Ministry of Finance has placed funds for investment in the GPFG in the form of a Norwegian krone deposit with Norges Bank (the krone account). Norges Bank manages the krone account in its own name by investing the funds in an investment portfolio consisting of listed equities, bonds, real estate and renewable energy infrastructure. The GPFG is invested in its entirety outside of Norway.
Transfers are made to and from the krone account in accordance with the management mandate. When the Norwegian State’s petroleum revenue exceeds the use of petroleum revenue in the fiscal budget, deposits will be made into the krone account. In the opposite situation, withdrawals will be made. Transfers to and from the krone account lead to a corresponding change in owner's capital.
Approval of the interim financial statements
The interim financial statements of Norges Bank for the first half of 2023, which only encompass the financial reporting for the GPFG, were approved by the Executive Board on 10 August 2023.
Note 2 Accounting policies
Basis of preparation
The Regulation on the financial reporting of Norges Bank (the Regulation), which has been laid down by the Ministry of Finance, requires that the financial reporting of the GPFG is prepared in accordance with International Financial Reporting Standards (IFRS) as adopted by the EU.
The condensed interim financial statements for the first half of 2023 are prepared in accordance with IAS 34 Interim Financial Reporting. The interim financial statements are presented in Norwegian kroner (NOK), rounded to the nearest million. Rounding differences may occur.
The interim financial statements are prepared using the same accounting policies and calculation methods as applied and disclosed in the annual report for 2022. The condensed interim financial statements do not include all the information and disclosures required in annual financial statements and should therefore be read in conjunction with the annual report for 2022.
Significant estimates and accounting judgements
The preparation of the interim financial statements involves the use of uncertain estimates and assumptions relating to future events that affect the reported amounts for assets, liabilities, income and expenses. Estimates are based on historical experience and reflect management’s expectations about future events. Actual outcomes may deviate from estimates. The preparation of the interim financial statements also involves the use of judgement when applying accounting policies, which may have a significant impact on the financial statements.
In cases where there are particularly uncertain estimates or accounting judgements, this is described in the respective notes.
Note 3 Returns
Table 3.1 Returns
|
1H 2023 |
1H 2022 |
2022 |
|
|---|---|---|---|
|
Returns measured in the fund's currency basket (percent) |
|||
|
Return on equity investments |
13.66 |
-17.05 |
-15.36 |
|
Return on fixed-income investments |
2.25 |
-9.32 |
-12.11 |
|
Return on unlisted real estate investments |
-4.57 |
7.12 |
0.07 |
|
Return on unlisted infrastructure investments |
-6.53 |
-13.29 |
5.12 |
|
Return on fund |
10.00 |
-14.41 |
-14.11 |
|
Relative return on fund (percentage points)1 |
-0.23 |
1.13 |
0.87 |
|
Returns measured in Norwegian kroner (percent) |
|||
|
Return on equity investments |
23.80 |
-11.19 |
-9.27 |
|
Return on fixed-income investments |
11.36 |
-2.91 |
-5.78 |
|
Return on unlisted real estate investments |
3.94 |
14.69 |
7.27 |
|
Return on unlisted infrastructure investments |
1.81 |
-7.16 |
12.69 |
|
Return on fund |
19.80 |
-8.36 |
-7.93 |
1 The relative return on the fund for 1H 2022 has been adjusted down by 0.01 percentage point due to an update of the return on the benchmark index.
For additional information on the calculation methods used when measuring returns, see note 3 Returns in the annual report for 2022.
Note 4 Income/expense from equities, bonds and financial derivatives
Tables 4.1 to 4.3 specify the income and expense elements for equities, bonds and financial derivatives, where the line Income/expense shows the amount recognised in profit or loss for the respective income statement line.
Table 4.1 Specification Income/expense from equities
|
Amounts in NOK million |
1H 2023 |
1H 2022 |
2022 |
|---|---|---|---|
|
Dividends |
143 696 |
114 063 |
197 631 |
|
Realised gain/loss |
110 967 |
151 303 |
191 774 |
|
Unrealised gain/loss |
1 215 992 |
-1 649 037 |
-1 591 241 |
|
Income/expense from equities before foreign exchange gain/loss |
1 470 655 |
-1 383 671 |
-1 201 835 |
Table 4.2 Specification Income/expense from bonds
|
Amounts in NOK million |
1H 2023 |
1H 2022 |
2022 |
|---|---|---|---|
|
Interest |
51 263 |
28 019 |
66 093 |
|
Realised gain/loss |
-63 804 |
-58 224 |
-130 749 |
|
Unrealised gain/loss |
66 090 |
-309 698 |
-388 472 |
|
Income/expense from bonds before foreign exchange gain/loss |
53 550 |
-339 903 |
-453 128 |
Table 4.3 Specification Income/expense from financial derivatives
|
Amounts in NOK million |
1H 2023 |
1H 2022 |
2022 |
|---|---|---|---|
|
Interest |
817 |
5 780 |
7 449 |
|
Realised gain/loss |
6 502 |
7 703 |
12 616 |
|
Unrealised gain/loss |
858 |
7 788 |
3 862 |
|
Income/expense from financial derivatives before foreign exchange gain/loss |
8 177 |
21 271 |
23 926 |
Note 5 Holdings of equities, bonds and financial derivatives
Table 5.1 Equities
|
30.06.2023 |
31.12.2022 |
|||
|---|---|---|---|---|
|
Amounts in NOK million |
Fair value incl. |
Earned dividends |
Fair value incl. |
Earned dividends |
|
Equities |
10 837 980 |
15 237 |
8 590 402 |
10 306 |
|
Total equities |
10 837 980 |
15 237 |
8 590 402 |
10 306 |
|
Of which equities lent |
482 329 |
451 799 |
||
Table 5.2 Bonds
|
30.06.2023 |
31.12.2022 |
|||||
|---|---|---|---|---|---|---|
|
Amounts in NOK million |
Notional value |
Fair value |
Earned interest |
Notional value |
Fair value |
Earned interest |
|
Government bonds |
2 432 539 |
2 243 091 |
13 869 |
2 366 163 |
2 165 605 |
10 509 |
|
Government-related bonds |
461 747 |
421 964 |
2 917 |
427 547 |
381 848 |
2 034 |
|
Inflation-linked bonds |
294 497 |
283 953 |
701 |
250 560 |
243 441 |
485 |
|
Corporate bonds |
1 081 781 |
985 761 |
9 998 |
930 570 |
829 314 |
8 145 |
|
Securitised bonds |
316 789 |
282 018 |
1 443 |
269 778 |
234 618 |
1 045 |
|
Total bonds |
4 587 352 |
4 216 787 |
28 928 |
4 244 619 |
3 854 827 |
22 218 |
|
Of which bonds lent |
393 327 |
886 555 |
||||
Financial derivatives
Financial derivatives such as foreign exchange derivatives, interest rate derivatives, credit derivatives and futures, are used to adjust the exposure in various portfolios as a cost-efficient alternative to trading in the underlying securities. Foreign exchange derivatives are also used in connection with liquidity management. Equity derivatives with an option component are often a result of corporate actions, and can be converted into equities or sold. The GPFG also uses equity swaps in combination with purchase and sale of equities. Equity swaps are not recognised in the balance sheet. See the accounting policy in note 13 Secured lending and borrowing in the annual report for 2022 for further information.
Table 5.3 specifies financial derivatives recognised in the balance sheet. Notional amounts are the basis for calculating any cash flows and gains/losses for derivative contracts. This provides information on the extent to which different types of financial derivatives are used.
Table 5.3 Financial derivatives
|
30.06.2023 |
31.12.2022 |
|||||
|---|---|---|---|---|---|---|
|
Amounts in NOK million |
Notional amount |
Fair value |
Notional amount |
Fair value |
||
|
Asset |
Liability |
Asset |
Liability |
|||
|
Foreign exchange derivatives |
908 478 |
10 643 |
8 351 |
1 028 213 |
6 955 |
28 135 |
|
Interest rate derivatives |
567 742 |
14 762 |
12 781 |
390 528 |
13 049 |
11 615 |
|
Credit derivatives |
97 520 |
84 |
1 553 |
53 290 |
- |
375 |
|
Equity derivatives1 |
- |
405 |
- |
- |
274 |
- |
|
Exchange-traded futures contracts2 |
101 731 |
5 |
31 |
91 638 |
221 |
34 |
|
Total financial derivatives |
1 675 471 |
25 899 |
22 717 |
1 563 669 |
20 498 |
40 159 |
1 Notional amounts are not considered relevant for equity derivatives and are therefore not included in the table.
2 Exchange-traded futures contracts are settled daily with margin payments and fair value is normally zero at the balance sheet date, with the exception of futures contracts in certain markets where there is different timing for setting the market value for recognition in the balance sheet and daily margining.
Note 6 Unlisted real estate
Investments in unlisted real estate are made through subsidiaries of Norges Bank, exclusively established as part of the management of the GPFG. Subsidiaries presented as Unlisted real estate in the balance sheet are measured at fair value through profit or loss. The fair value of unlisted real estate is equivalent to the sum of the GPFG’s share of assets and liabilities in the underlying subsidiaries, measured at fair value. For further information, see note 2 Accounting policies and note 8 Fair value measurement in the annual report for 2022.
Income/expense, changes in carrying amounts and cash flows related to investments in unlisted real estate are specified in the tables below. See note 6 Unlisted real estate in the annual report for 2022 for further information on the principles applied in the tables.
Table 6.1 Income/expense from unlisted real estate
|
Amounts in NOK million |
1H 2023 |
1H 2022 |
2022 |
|---|---|---|---|
|
Payments of interest and dividend |
3 367 |
2 969 |
6 156 |
|
Unrealised gain/loss1 |
-24 201 |
18 762 |
-8 369 |
|
Income/expense from unlisted real estate before foreign exchange gain/loss |
-20 834 |
21 732 |
-2 213 |
1 Earned interest and dividends which are not cash-settled are included in Unrealised gain/loss.
Table 6.2 Changes in carrying amounts unlisted real estate
|
Amounts in NOK million |
30.06.2023 |
31.12.2022 |
|---|---|---|
|
Unlisted real estate at 1 January |
329 732 |
310 134 |
|
Net cash flow to/from investments |
4 382 |
3 930 |
|
Unrealised gain/loss |
-24 201 |
-8 369 |
|
Foreign exchange gain/loss |
33 798 |
24 036 |
|
Unlisted real estate, closing balance for the period |
343 711 |
329 732 |
Table 6.3 specifies cash flows between the GPFG and subsidiaries presented as Unlisted real estate, related to ongoing operations and other activities.
Table 6.3 Cash flow unlisted real estate
|
Amounts in NOK million |
1H 2023 |
1H 2022 |
2022 |
|---|---|---|---|
|
Interest from ongoing operations |
1 007 |
649 |
1 568 |
|
Dividend from ongoing operations |
2 360 |
1 933 |
4 200 |
|
Repayments of intercompany loans and paid-in capital from ongoing operations |
761 |
652 |
1 694 |
|
Cash flow from ongoing operations unlisted real estate |
4 128 |
3 234 |
7 463 |
|
Payments for new investments |
-4 449 |
-724 |
-7 074 |
|
Payments for property development |
-876 |
-415 |
-1 186 |
|
Net payments external debt |
- |
72 |
72 |
|
Repayments of intercompany loans from sales |
182 |
2 564 |
2 564 |
|
Interest from sales |
- |
219 |
219 |
|
Dividend from sales |
- |
168 |
168 |
|
Cash flow to/from other activities unlisted real estate |
-5 144 |
1 884 |
-5 237 |
|
Net cash flow unlisted real estate1 |
-1 016 |
5 118 |
2 225 |
1 Shown in the statement of cash flows as Receipts of interest and dividend from unlisted real estate and Net cash flow to/from investments in unlisted real estate. In the first half of 2023 this amounted to NOK 3 367 million and NOK -4 382 million, respectively (NOK 2 969 million and NOK 2 148 million in the first half of 2022).
Underlying real estate companies
Real estate subsidiaries have investments in other non-consolidated, unlisted companies. For further information, see note 16 Interests in other entities in the annual report for 2022.
Table 6.4 specifies the GPFG’s share of net income generated in the underlying real estate companies, which is the basis for Income/expense from unlisted real estate presented in table 6.1.
Table 6.4 Income from underlying real estate companies
|
Amounts in NOK million |
1H 2023 |
1H 2022 |
2022 |
|---|---|---|---|
|
Net rental income |
6 945 |
6 044 |
12 807 |
|
External asset management - fixed fees |
-540 |
-525 |
-1 071 |
|
External asset management - variable fees |
-2 |
-13 |
-33 |
|
Internal asset management - fixed fees1 |
-62 |
-47 |
-99 |
|
Operating costs in wholly-owned subsidiaries2 |
-41 |
-32 |
-65 |
|
Operating costs in joint ventures |
-58 |
-68 |
-166 |
|
Interest expense external debt |
-420 |
-320 |
-644 |
|
Tax expense |
-133 |
-123 |
-303 |
|
Net income from ongoing operations |
5 688 |
4 916 |
10 427 |
|
Realised gain/loss |
1 |
767 |
769 |
|
Unrealised gain/loss3 |
-26 302 |
16 155 |
-13 085 |
|
Realised and unrealised gain/loss |
-26 301 |
16 922 |
-12 316 |
|
Transaction costs and fees from purchases and sales |
-222 |
-106 |
-324 |
|
Net income underlying real estate companies |
-20 834 |
21 732 |
-2 213 |
1 Internal asset management is carried out on 100 percent owned properties by employees in a wholly-owned, consolidated subsidiary.
2 Operating costs in wholly-owned subsidiaries are measured against the upper limit from the Ministry of Finance, see note 11 Management costs for more information.
3 Unrealised gain/loss presented in table 6.1 includes net income in the underlying real estate companies which is not distributed back to the GPFG, and will therefore not correspond to Unrealised gains/loss presented in table 6.4.
Table 6.5 specifies the GPFG’s share of assets and liabilities in the underlying real estate companies, which comprises the closing balance for Unlisted real estate presented in table 6.2.
Table 6.5 Assets and liabilities underlying real estate companies
|
Amounts in NOK million |
30.06.2023 |
31.12.2022 |
|---|---|---|
|
Properties |
372 869 |
356 518 |
|
External debt |
-26 787 |
-24 751 |
|
Net other assets and liabilities1 |
-2 370 |
-2 036 |
|
Total assets and liabilities underlying real estate companies |
343 711 |
329 732 |
1 Net other assets and liabilities comprise cash, tax and operational receivables and liabilities.
Note 7 Unlisted renewable energy infrastructure
Investments in unlisted renewable energy infrastructure (Unlisted infrastructure) are made through subsidiaries of Norges Bank, exclusively established as part of the management of the GPFG. Subsidiaries presented as Unlisted infrastructure in the balance sheet are measured at fair value through profit or loss. The fair value of unlisted infrastructure is equivalent to the sum of the GPFG’s share of assets and liabilities in the underlying subsidiaries, measured at fair value. For further information, see note 2 Accounting policies and note 8 Fair value measurement in the annual report for 2022.
Income/expense, changes in carrying amounts and cash flows related to investments in unlisted infrastructure are specified in the tables below. See note 7 Unlisted renewable energy infrastructure in the annual report for 2022 for further information on the principles applied in the tables.
Table 7.1 Income/expense from unlisted infrastructure
|
Amounts in NOK million |
1H 2023 |
1H 2022 |
2022 |
|---|---|---|---|
|
Payments of interest and dividend |
457 |
96 |
162 |
|
Unrealised gain/loss1 |
-2 226 |
-1 257 |
735 |
|
Income/expense from unlisted infrastructure before foreign exchange gain/loss |
-1 769 |
-1 162 |
897 |
1 Earned interest and dividends which are not cash-settled is included in Unrealised gain/loss.
Table 7.2 Changes in carrying amounts unlisted infrastructure
|
Amounts in NOK million |
30.06.2023 |
31.12.2022 |
|---|---|---|
|
Unlisted infrastructure at 1 January |
14 489 |
14 287 |
|
Net cash flow to/from investments |
1 923 |
-1 143 |
|
Unrealised gain/loss |
-2 226 |
735 |
|
Foreign exchange gain/loss |
1 531 |
609 |
|
Unlisted infrastructure, closing balance for the period |
15 717 |
14 489 |
Table 7.3 specifies cash flows between the GPFG and subsidiaries presented as Unlisted infrastructure, related to ongoing operations and other activities.
Table 7.3 Cash flow unlisted infrastructre
|
Amounts in NOK million |
1H 2023 |
1H 2022 |
2022 |
|---|---|---|---|
|
Interest from ongoing operations |
143 |
96 |
162 |
|
Dividend from ongoing operations |
314 |
- |
- |
|
Repayments of intercompany loans and paid-in capital from ongoing operations |
720 |
373 |
1 143 |
|
Cash flow from ongoing operations unlisted infrastructure |
1 177 |
469 |
1 305 |
|
Payments for new investments |
-2 643 |
- |
- |
|
Cash flow to/from other activities unlisted infrastructure |
-2 643 |
- |
- |
|
Net cash flow unlisted infrastructure1 |
-1 466 |
469 |
1 305 |
1 Shown in the statement of cash flows as Receipts of interest and dividend from unlisted infrastructure and Net cash flow to/from investments in unlisted infrastructure. In the first half of 2023 this amounted to NOK 457 million and NOK -1 923 million respectively (NOK 96 million and NOK 373 million in the first half of 2022).
Underlying infrastructure companies
Infrastructure subsidiaries have investments in other non-consolidated, unlisted companies. For further information, see note 16 Interests in other entities in the annual report for 2022.
Table 7.4 specifies the GPFG’s share of net income generated in the underlying infrastructure companies, which is the basis for Income/expense from unlisted infrastructure presented in table 7.1.
Table 7.4 Income from underlying infrastructure companies
|
Amounts in NOK million |
1H 2023 |
1H 2022 |
2022 |
|---|---|---|---|
|
Net income from sale of renewable energy |
757 |
1 143 |
2 175 |
|
Operating costs in wholly-owned subsidiaries1 |
-3 |
-3 |
-6 |
|
Operating costs in joint ventures |
-8 |
-15 |
-16 |
|
Tax expense |
-65 |
-140 |
-353 |
|
Interest income/expense |
12 |
1 |
- |
|
Net income from ongoing operations |
692 |
985 |
1 799 |
|
Unrealised gain/loss2 |
-2 421 |
-2 160 |
-898 |
|
Transaction costs and fees from purchases and sales |
-40 |
14 |
-4 |
|
Net income underlying infrastructure companies |
-1 769 |
-1 162 |
897 |
1 Operating costs in wholly-owned subsidiaries are measured against the upper limit from the Ministry of Finance, see note 11 Management costs for more information.
2 Unrealised gain/loss presented in table 7.1 includes net income in the underlying infrastructure companies which is not distributed back to the GPFG, and will therefore not correspond to Unrealised gains/loss presented in table 7.4.
Table 7.5 specifies the GPFG’s share of assets and liabilities in the underlying infrastructure companies, which comprises the closing balance for Unlisted infrastructure as presented in table 7.2.
Table 7.5 Assets and liabilities underlying infrastructure companies
|
Amounts in NOK million |
30.06.2023 |
31.12.2022 |
|---|---|---|
|
Infrastructure assets |
14 061 |
13 983 |
|
Net other assets and liabilities1 |
1 656 |
506 |
|
Total assets and liabilities underlying infrastructure companies |
15 717 |
14 489 |
1 Net other assets and liabilities comprise cash, tax and operational receivables and liabilities.
Agreements for purchases and sales of infrastructure
Table 7.6 provides an overview of announced agreements for purchases and sales of infrastructure assets which are not completed at the balance sheet date.
Table 7.6 Announced agreements for purchases of infrastructure assets1
|
Type |
Country |
Ownership percent |
Currency |
Price in stated currency (million)2 |
Quarter announced |
Expected |
|---|---|---|---|---|---|---|
|
Purchase3 |
Spain |
49.0 |
EUR |
522 |
Q1 2023 |
Q4 2023 - Q2 2025 |
|
Purchase |
Germany |
16.6 |
EUR |
430 |
Q1 2023 |
Q3 2023 |
1 Purchases and sales above USD 100 million are announced.
2 The stated price is for the GPFG's share.
3 In January 2023, Norges Bank entered into agreements to acquire a 49 percent interest in a portfolio of twelve solar and onshore wind farms in Spain. Of the twelve projects, nine are under development and expected to be completed between Q4 2023 and Q2 2025. Norges Bank will take ownership of these when they become operational. The price in the table represents the remaining payment obligations as of the balance sheet date.
Note 8 Fair value measurement
Fair value for the majority of assets and liabilities is based on quoted market prices or observable market inputs. If the market is not active, fair value is established using standard valuation techniques. Estimating fair value can be complex and require the use of judgement, in particular when observable inputs are not available. For an overview of valuation models and techniques, as well as definitions and the classification in the three categories in the fair value hierarchy, see note 8 Fair value measurement in the annual report for 2022.
Significant estimates
Classification in the fair value hierarchy is based on set criteria, some of which may require the use of judgement.
Level 3 investments consist of instruments measured at fair value that are not traded or quoted in active markets. Fair value is determined using valuation techniques that use models with significant use of unobservable inputs. A considerable degree of judgement is applied in determining the assumptions that market participants would use when pricing the asset or liability, when observable market data is not available.
The fair value hierarchy
Table 8.1 Categorisation of the investment portfolio by level in the fair value hierarchy
|
Level 1 |
Level 2 |
Level 3 |
Total |
|||||
|---|---|---|---|---|---|---|---|---|
|
Amounts in NOK million |
30.06.2023 |
31.12.2022 |
30.06.2023 |
31.12.2022 |
30.06.2023 |
31.12.2022 |
30.06.2023 |
31.12.2022 |
|
Equities |
10 799 864 |
8 556 594 |
36 640 |
30 602 |
1 476 |
3 206 |
10 837 980 |
8 590 402 |
|
Government bonds |
1 998 127 |
1 929 618 |
244 964 |
235 987 |
- |
- |
2 243 091 |
2 165 605 |
|
Government-related bonds |
364 226 |
303 108 |
56 797 |
78 406 |
941 |
334 |
421 964 |
381 848 |
|
Inflation-linked bonds |
242 317 |
204 037 |
41 636 |
39 404 |
- |
- |
283 953 |
243 441 |
|
Corporate bonds |
918 470 |
740 645 |
67 287 |
88 663 |
4 |
6 |
985 761 |
829 314 |
|
Securitised bonds |
256 312 |
202 781 |
25 706 |
31 837 |
- |
- |
282 018 |
234 618 |
|
Total bonds |
3 779 452 |
3 380 189 |
436 390 |
474 297 |
945 |
340 |
4 216 787 |
3 854 827 |
|
Financial derivatives (assets) |
460 |
429 |
25 438 |
20 024 |
1 |
45 |
25 899 |
20 498 |
|
Financial derivatives (liabilities) |
-1 584 |
-409 |
-21 133 |
-39 750 |
- |
- |
-22 717 |
-40 159 |
|
Total financial derivatives |
-1 124 |
20 |
4 305 |
-19 726 |
1 |
45 |
3 182 |
-19 661 |
|
Unlisted real estate |
- |
- |
- |
- |
343 711 |
329 732 |
343 711 |
329 732 |
|
Unlisted infrastructure |
- |
- |
- |
- |
15 717 |
14 489 |
15 717 |
14 489 |
|
Other (assets)1 |
- |
- |
509 988 |
519 026 |
- |
- |
509 988 |
519 026 |
|
Other (liabilities)2 |
- |
- |
-627 956 |
-859 756 |
- |
- |
-627 956 |
-859 756 |
|
Total |
14 578 192 |
11 936 803 |
359 367 |
144 443 |
361 850 |
347 812 |
15 299 410 |
12 429 059 |
|
Total (percent) |
95.3 |
96.0 |
2.3 |
1.2 |
2.4 |
2.8 |
100.0 |
100.0 |
1 Other (assets) consists of the balance sheet lines Deposits in banks, Secured lending, Cash collateral posted, Unsettled trades (assets), Withholding tax receivable and Other assets.
2 Other (liabilities) consists of the balance sheet lines Secured borrowing, Cash collateral received, Unsettled trades (liabilities), Deferred tax and Other liabilities.
The majority of the total portfolio is priced based on observable market prices. At the end of the first half of 2023, 97.6 percent of the portfolio was classified as Level 1 or 2, which is a slight increase compared to year-end 2022.
Equities
Measured as a share of total value, virtually all equities (99.65 percent) were valued based on official closing prices from stock exchanges and classified as Level 1 at the end of the first half. A small share of equities (0.34 percent) were classified as Level 2 at the end of the first half. These are mainly equities for which trading has recently been suspended, or illiquid securities that are not traded daily. The share of equities valued with significant use of unobservable inputs and classified as Level 3 at the end of the first half was 0.01 percent. These are equities that are not listed, or where trading has been suspended and an adjustment has been applied to the last traded price based on company- or country-specific factors.
Bonds
The majority of bonds have observable, executable market quotes in active markets and 89.63 percent were classified as Level 1 at the end of the first half. Bond holdings that do not have a sufficient number of observable quotes or that are priced based on comparable liquid bonds are classified as Level 2. These amounted to 10.35 percent of bond holdings at the end of the first half. An insignificant share of bond holdings (0.02 percent) that did not have observable quotes were classified as Level 3 at the end of the first half, since the valuation was based on significant use of unobservable inputs.
Unlisted real estate and unlisted renewable energy infrastructure
All investments in unlisted real estate and unlisted renewable energy infrastructure are classified as Level 3, since models are used to value the underlying assets and liabilities, with extensive use of unobservable market inputs. Properties and investments in unlisted infrastructure are measured at the value determined by external valuers. Exceptions to this policy are newly acquired investments where the purchase price, excluding transaction costs, is normally considered to be the best estimate of fair value, or where there are indications that the external valuation does not reflect fair value and adjustments are therefore warranted.
Financial derivatives
Some equity derivatives (rights and warrants) and credit derivatives (CDS indices) that are actively traded, are classified as Level 1. The majority of derivatives are classified as Level 2, since the valuation of these is based on standard models using observable market inputs. Certain derivatives are valued based on models with significant use of unobservable inputs and are classified as Level 3.
Other assets and liabilities that are part of the investment portfolio are classified as Level 2.
Movements between the levels in the fair value hierarchy
Reclassifications between Level 1 and Level 2
There were no significant reclassifications of equity holdings between Level 1 and Level 2 during the first half.
Bond holdings of NOK 81 billion were reclassified from Level 2 to Level 1 during the first half, primarily due to improved liquidity for certain holdings of corporate bonds and government bonds denominated in USD. This was offset by NOK 55 billion of bond holdings that were reclassified from Level 1 to Level 2 due to reduced price observability, primarily for Japanese government bonds and certain holdings of corporate bonds.
Reclassifications between Level 2 and Level 3
During the first half, NOK 650 million of government-related bonds were reclassified from Level 2 to Level 3. This increased the relative share of bonds classified as Level 3 compared to year-end 2022.
Table 8.2 Changes in Level 3 holdings
|
Amounts in NOK million |
01.01.2023 |
Purchases |
Sales |
Settlements |
Net gain/loss |
Transferred into Level 3 |
Transferred out of Level 3 |
Foreign exchange gain/loss |
30.06.2023 |
|---|---|---|---|---|---|---|---|---|---|
|
Equities |
3 206 |
- |
-9 |
-4 |
-1 559 |
5 |
-6 |
-157 |
1 476 |
|
Bonds |
340 |
152 |
-147 |
-54 |
34 |
651 |
-97 |
65 |
945 |
|
Financial derivatives (assets) |
45 |
- |
-44 |
- |
- |
- |
- |
- |
1 |
|
Unlisted real estate1 |
329 732 |
4 382 |
- |
- |
-24 201 |
- |
- |
33 798 |
343 711 |
|
Unlisted infrastructure1 |
14 489 |
1 923 |
- |
- |
-2 226 |
- |
- |
1 531 |
15 717 |
|
Total |
347 812 |
6 457 |
-200 |
-59 |
-27 952 |
656 |
-103 |
35 238 |
361 850 |
|
Amounts in NOK million |
01.01.2022 |
Purchases |
Sales |
Settlements |
Net gain/loss |
Transferred into Level 3 |
Transferred out of Level 3 |
Foreign exchange gain/loss |
31.12.2022 |
|---|---|---|---|---|---|---|---|---|---|
|
Equities |
1 349 |
83 |
-1 014 |
310 |
-28 634 |
27 678 |
-152 |
3 585 |
3 206 |
|
Bonds |
7 |
237 |
- |
- |
-20 |
103 |
- |
13 |
340 |
|
Financial derivatives (assets) |
- |
- |
- |
- |
-20 |
60 |
- |
5 |
45 |
|
Unlisted real estate1 |
310 134 |
3 930 |
- |
- |
-8 369 |
- |
- |
24 036 |
329 732 |
|
Unlisted infrastructure1 |
14 287 |
-1 143 |
- |
- |
735 |
- |
- |
609 |
14 489 |
|
Total |
325 777 |
3 108 |
-1 014 |
310 |
-36 308 |
27 841 |
-152 |
28 248 |
347 812 |
1 Purchases represent the net cash flow to investments in unlisted real estate and unlisted infrastructure, as presented in the Statement of cash flows.
The share of the portfolio classified as Level 3 was 2.4 percent at the end of the first half, which is a slight decrease compared to year-end 2022. The GPFG’s aggregate holdings in Level 3 were NOK 361 850 million at the end of the first half, an increase of NOK 14 038 million compared to year-end 2022.
Equities classified as Level 3 consist primarily of Russian securities that are suspended from trading or trading with restrictions. In line with the methodology applied at year-end, a downward adjustment has been applied to the last traded price of these securities. The adjustment reflects the estimated discount that market participants would demand to reflect the risk associated with the inherent uncertainty in the cash flows of the shareholdings, as well as the inability to access a public market to trade the shares. The adjustment to the last traded price is based on unobservable inputs and is considered to be significant to the fair value measurement. At the end of the first half, these equity securities had a value of NOK 1.3 billion, compared to NOK 3 billion at year-end 2022.
Sensitivity analysis for Level 3 holdings
The valuation of Level 3 holdings involves the use of judgement when determining the assumptions that market participants would use when observable market data is not available.
Unlisted real estate investments constitute the vast majority of holdings classified as Level 3. The effect of using reasonable alternative assumptions for unlisted real estate investments is shown in the sensitivity analysis in table 8.3. For other holdings classified as Level 3, there are no significant changes to sensitivities compared to year-end 2022.
Table 8.3 Additional specification Level 3 and sensitivities - unlisted real estate
|
Amounts in NOK million |
Key assumptions |
Change in key assumptions |
Specification of Level 3 holdings 30.06.2023 |
Sensitivities 30.06.2023 |
Specification of Level 3 holdings 31.12.2022 |
Sensitivities 31.12.2022 |
||
|---|---|---|---|---|---|---|---|---|
|
Unfavourable changes |
Favourable changes |
Unfavourable changes |
Favourable changes |
|||||
|
Unlisted real estate |
Yield |
0.2 percentage point |
-16 620 |
18 655 |
-15 944 |
17 896 |
||
|
Market rent |
2.0 percent |
-5 590 |
5 598 |
-5 362 |
5 370 |
|||
|
343 711 |
-22 209 |
24 253 |
329 732 |
-21 306 |
23 266 |
|||
Changes in key assumptions can have a material effect on the valuation of unlisted real estate investments. A number of key assumptions are used, of which yields and growth forecasts for future market rents are the assumptions that have the largest impact when estimating property values. This is illustrated in the sensitivity analysis by using other reasonable assumptions for yields and market rents. The sensitivity analysis is based on a statistically relevant sample that is representative for the unlisted real estate portfolio, and reflects both favourable and unfavourable changes.
In an unfavourable outcome, an increase in the yield of 0.2 percentage point, and a reduction in market rents of 2 percent would result in a decrease in value of the unlisted real estate portfolio of approximately NOK 22 209 million or 6.5 percent (6.5 percent at year-end 2022). In a favourable outcome, a reduction in the yield of 0.2 percentage point and an increase in market rents of 2 percent would result in an increase in value of the unlisted real estate portfolio of approximately NOK 24 253 million or 7.1 percent (7.1 percent at year-end 2022). The isolated effects of changes in yields and future market rents are presented in table 8.3.
Changes outside of the ranges specified above are considered to be less reasonable alternative assumptions, however if the range of alternative assumptions were to be expanded, the value changes would be linear.
Note 9 Investment risk
Investment risk comprises market risk, credit risk and counterparty risk. For further information on the framework for investment risk, including the main dimensions and measurement methods used to manage investment risk, see note 9 Investment risk in the annual report for 2022.
Market risk
Market risk is the risk of loss or a change in the market value of the portfolio, or parts of the portfolio, due to changes in financial market variables, as well as real estate and infrastructure values. Norges Bank Investment Management measures market risk both in absolute terms and relative to the benchmark.
Asset class by country and currency
The portfolio is invested across several asset classes, countries and currencies as shown in table 9.1.
Table 9.1 Allocation by asset class, country and currency
|
Market value in percent by country and currency1 |
Market value in percent by asset class |
Assets minus liabilities excluding management fee |
|||||||
|---|---|---|---|---|---|---|---|---|---|
|
Asset class |
Market |
30.06.2023 |
Market |
31.12.2022 |
30.06.2023 |
31.12.2022 |
30.06.2023 |
31.12.2022 |
|
|
Equities |
Developed |
89.7 |
Developed |
89.1 |
|||||
|
US |
47.3 |
US |
44.7 |
||||||
|
Japan |
7.3 |
Japan |
7.3 |
||||||
|
UK |
6.5 |
UK |
7.0 |
||||||
|
France |
4.6 |
France |
4.8 |
||||||
|
Switzerland |
4.3 |
Switzerland |
4.5 |
||||||
|
Total other |
19.7 |
Total other |
20.8 |
||||||
|
Emerging |
10.3 |
Emerging |
10.9 |
||||||
|
China |
3.4 |
China |
3.8 |
||||||
|
Taiwan |
2.1 |
India |
2.0 |
||||||
|
India |
1.9 |
Taiwan |
2.0 |
||||||
|
Brazil |
0.6 |
Brazil |
0.5 |
||||||
|
Mexico |
0.4 |
South Africa |
0.4 |
||||||
|
Total other |
1.9 |
Total other |
2.2 |
||||||
|
Total equities |
71.25 |
69.77 |
10 901 268 |
8 672 186 |
|||||
|
Fixed income |
Developed |
99.8 |
Developed |
99.7 |
|||||
|
US dollar |
49.8 |
US dollar |
50.2 |
||||||
|
Euro |
29.3 |
Euro |
28.1 |
||||||
|
Japanese yen |
7.5 |
Japanese yen |
8.0 |
||||||
|
British pound |
4.7 |
British pound |
4.5 |
||||||
|
Canadian dollar |
3.6 |
Canadian dollar |
3.8 |
||||||
|
Total other |
4.8 |
Total other |
5.1 |
||||||
|
Emerging2 |
0.2 |
Emerging2 |
0.3 |
||||||
|
Total fixed income |
26.39 |
27.45 |
4 037 260 |
3 412 044 |
|||||
|
Unlisted real estate |
US |
49.7 |
US |
51.8 |
|||||
|
UK |
17.8 |
France |
16.5 |
||||||
|
France |
16.1 |
UK |
16.4 |
||||||
|
Germany |
5.7 |
Germany |
5.0 |
||||||
|
Switzerland |
3.6 |
Switzerland |
3.4 |
||||||
|
Total other |
7.1 |
Total other |
7.0 |
||||||
|
Total unlisted real estate |
2.25 |
2.66 |
344 529 |
330 300 |
|||||
|
Total unlisted infrastructure |
0.11 |
0.12 |
16 353 |
14 530 |
|||||
1 Market value in percent per country and currency includes derivatives and cash.
2 The share of individual emerging market currencies in fixed income is insignificant.
At the end of the first half, the equity portfolio’s share of the fund was 71.3 percent, compared to 69.8 percent at year-end 2022. The bond portfolio’s share of the fund was 26.4 percent, compared to 27.5 percent at year-end. The unlisted real estate portfolio’s share of the fund was 2.3 percent, compared to 2.7 percent at year-end. The share of unlisted infrastructure in the fund was 0.1 percent, the same as at year-end.
Volatility
Risk models are used to quantify the risk of value changes associated with all or parts of the portfolio. One of the risk measures is expected volatility. Volatility is a standard risk measure based on the statistical concept of standard deviation. Expected volatility is defined as one standard deviation. Tables 9.2 and 9.3 present risk both in terms of the portfolio’s absolute risk and the relative risk. All the fund’s investments are included in the calculations of expected relative volatility, and are measured against the fund’s benchmark index consisting of global equity and bond indices. The fund’s management mandate specifies that expected relative volatility shall not exceed 1.25 percentage points.
Table 9.2 Portfolio risk, expected volatility, percent
|
Expected volatility, actual portfolio |
||||||||
|---|---|---|---|---|---|---|---|---|
|
30.06.2023 |
Min 2023 |
Max 2023 |
Average 2023 |
31.12.2022 |
Min 2022 |
Max 2022 |
Average 2022 |
|
|
Portfolio |
9.3 |
8.7 |
10.8 |
9.7 |
10.1 |
9.6 |
10.4 |
10.1 |
|
Equities |
11.9 |
11.3 |
15.0 |
12.8 |
14.2 |
13.8 |
14.4 |
14.2 |
|
Fixed income |
10.1 |
9.8 |
11.2 |
10.4 |
11.1 |
10.0 |
11.1 |
10.7 |
|
Unlisted real estate |
12.2 |
11.8 |
12.9 |
12.3 |
12.1 |
11.7 |
12.4 |
12.0 |
|
Unlisted infrastructure |
34.1 |
14.9 |
40.0 |
29.8 |
14.9 |
8.9 |
14.9 |
11.7 |
Table 9.3 Relative risk measured against the fund's benchmark index, expected relative volatility, basis points
|
Expected relative volatility |
||||||||
|---|---|---|---|---|---|---|---|---|
|
30.06.2023 |
Min 2023 |
Max 2023 |
Average 2023 |
31.12.2022 |
Min 2022 |
Max 2022 |
Average 2022 |
|
|
Portfolio |
35 |
35 |
41 |
38 |
39 |
39 |
53 |
45 |
Risk measured as expected volatility indicates an expected annual fluctuation in the value of the fund of 9.3 percent, or approximately NOK 1 430 billion at the end of the first half, compared to 10.1 percent at year-end 2022. Expected volatility for the equity portfolio was 11.9 percent at the end of the first half, down from 14.2 percent at year-end, while expected volatility for the bond portfolio was 10.1 percent, compared to 11.1 percent at year-end.
The fund’s expected relative volatility was 35 basis points at the end of the first half, compared to 39 basis points at year-end 2022.
Expected shortfall is a tail risk measure that quantifies the expected loss of a portfolio in extreme market situations. Expected shortfall measured on relative returns provides an estimate of the annual expected relative underperformance versus the benchmark index for a given confidence level. Using historical simulations, relative returns of the current portfolio compared to the benchmark index are calculated on a weekly basis over a sampling period from January 2007 until the end of the last accounting period. The expected shortfall at a 97.5 percent confidence level is then given by the annualised average relative return, measured in the currency basket for the 2.5 percent worst weeks.
The Executive Board has determined that the fund shall be managed in such a way that the annual expected shortfall measured against the benchmark index does not exceed 3.75 percentage points. At the end of the first half, expected shortfall was 1.04 percentage points, compared to 1.22 percentage points at year-end 2022.
Credit risk
Credit risk is the risk of losses resulting from issuers of bonds defaulting on their payment obligations. Credit risk for the bond portfolio is monitored, among other things, through the use of credit ratings. Fixed-income instruments in the portfolio’s benchmark index are all rated investment grade by one of the major credit rating agencies.
Table 9.4 Bond portfolio specified by credit rating
|
Amounts in NOK million, |
AAA |
AA |
A |
BBB |
Lower |
Total |
|---|---|---|---|---|---|---|
|
Government bonds |
1 480 703 |
259 801 |
388 447 |
83 128 |
31 013 |
2 243 091 |
|
Government-related bonds |
206 287 |
153 283 |
36 799 |
22 378 |
3 218 |
421 964 |
|
Inflation-linked bonds |
177 865 |
71 303 |
17 397 |
17 388 |
- |
283 953 |
|
Corporate bonds |
9 957 |
69 013 |
460 316 |
434 846 |
11 628 |
985 761 |
|
Securitised bonds |
238 800 |
40 523 |
2 463 |
232 |
0 |
282 018 |
|
Total bonds |
2 113 612 |
593 923 |
905 421 |
557 972 |
45 859 |
4 216 787 |
|
Amounts in NOK million, |
AAA |
AA |
A |
BBB |
Lower |
Total |
|---|---|---|---|---|---|---|
|
Government bonds |
1 365 320 |
192 142 |
509 240 |
75 988 |
22 914 |
2 165 605 |
|
Government-related bonds |
173 893 |
136 251 |
51 670 |
18 168 |
1 867 |
381 848 |
|
Inflation-linked bonds |
154 708 |
58 278 |
14 368 |
16 087 |
- |
243 441 |
|
Corporate bonds |
7 761 |
61 407 |
366 585 |
383 325 |
10 236 |
829 314 |
|
Securitised bonds |
198 124 |
34 817 |
1 677 |
- |
- |
234 618 |
|
Total bonds |
1 899 805 |
482 896 |
943 540 |
493 569 |
35 018 |
3 854 827 |
The share of bond holdings with credit rating A decreased to 21.5 percent at the end of the first half, from 24.5 percent at the end of 2022. The decrease in the A category was mainly due to reduced holdings of Japanese government bonds. Bonds in the remaining credit rating categories increased somewhat during the period. The share of bond holdings in the Lower rating category increased to 1.1 percent at the end of the first half, from 0.9 percent at year-end. This was mainly due to a small increase in holdings of government bonds in this category. Overall, the credit quality of the bond portfolio was virtually unchanged compared to year-end.
Counterparty risk
Counterparty risk is the risk of loss due to counterparty bankruptcy or other events leading to counterparties defaulting.
Table 9.5 Counterparty risk by type of position
|
Risk exposure |
||
|---|---|---|
|
Amounts in NOK million |
30.06.2023 |
31.12.2022 |
|
Derivatives including foreign exchange contracts |
72 460 |
72 319 |
|
Securities lending |
51 815 |
62 291 |
|
Unsecured bank deposits1 and securities |
22 598 |
21 662 |
|
Repurchase and reverse repurchase agreements |
3 188 |
13 986 |
|
Settlement risk towards brokers and long-settlement transactions |
5 747 |
1 699 |
|
Total |
155 808 |
171 956 |
1 Includes bank deposits in non-consolidated subsidiaries.
Total counterparty risk exposure was reduced to NOK 155.8 billion at the end of the first half, from NOK 172.0 billion at year-end 2022. The decrease in risk exposure was mainly due to reduced exposure from securities lending and repurchase and reverse repurchase agreements, due to lower activity in these instruments. Counterparty risk exposure from securities lending decreased by 17 per cent in the period compared to year-end, while risk exposure from repurchase and reverse repurchase agreements decreased by 77 per cent compared to year-end. The risk exposure from derivatives including currency contracts was virtually unchanged compared to year-end, at NOK 72 billion. Derivatives and currency contracts accounted for 47 per cent of the total risk exposure at the end of the first half. One third of this exposure was to a clearing house.
Note 10 Foreign exchange gains and losses
Accounting judgement
Gains and losses on financial instruments are due to changes in the price of the instrument (security element) and changes in foreign exchange rates (foreign exchange element). These are presented separately in the income statement. See note 11 Foreign exchange gains and losses in the annual report for 2022 for further information on the method used to allocate the total gain/loss in Norwegian kroner to a security element and a foreign exchange element.
The market value of the fund in Norwegian kroner is impacted by changes in foreign exchange rates. See table 9.1 in note 9 Investment risk for an overview of the allocation of the GPFG’s investments per asset class, country and currency. The change in the fund’s market value due to changes in foreign exchange rates is presented in table 10.1.
Table 10.1 Specification foreign exchange gain/loss
|
Amounts in NOK million |
1H 2023 |
1H 2022 |
2022 |
|---|---|---|---|
|
Foreign exchange gain/loss - USD/NOK |
436 598 |
474 222 |
445 752 |
|
Foreign exchange gain/loss - EUR/NOK |
254 775 |
60 803 |
100 638 |
|
Foreign exchange gain/loss - JPY/NOK |
-10 580 |
-34 894 |
-11 871 |
|
Foreign exchange gain/loss - GBP/NOK |
105 872 |
2 140 |
-6 685 |
|
Foreign exchange gain/loss - CHF/NOK |
40 695 |
18 980 |
28 912 |
|
Foreign exchange gain/loss - other |
153 072 |
121 087 |
85 104 |
|
Foreign exchange gain/loss |
980 432 |
642 339 |
641 850 |
Note 11 Management costs
Management costs comprise all costs relating to the management of the fund. These are mainly incurred in Norges Bank, but management costs are also incurred in subsidiaries of Norges Bank that are exclusively established as part of the management of the GPFG’s investments in unlisted real estate and unlisted renewable energy infrastructure.
Management costs in Norges Bank
The Ministry of Finance reimburses Norges Bank for costs incurred in connection with the management of the GPFG, in the form of a management fee. The management fee is equivalent to the actual costs incurred by Norges Bank, including performance-based fees to external managers, and is expensed in the income statement line Management fee. Costs included in the management fee are specified in table 11.1.
Table 11.1 Management fee
|
1H 2023 |
1H 2022 |
2022 |
||||
|---|---|---|---|---|---|---|
|
Amounts in NOK million |
Basis points |
Basis points |
Basis points |
|||
|
Salary, social security and other personnel-related costs |
972 |
770 |
1 579 |
|||
|
Custody costs |
226 |
242 |
473 |
|||
|
IT services, systems, data and information |
383 |
311 |
632 |
|||
|
Research, consulting and legal fees |
128 |
137 |
247 |
|||
|
Other costs |
141 |
117 |
274 |
|||
|
Allocated costs Norges Bank |
138 |
153 |
339 |
|||
|
Base fees to external managers |
719 |
567 |
963 |
|||
|
Management fee excluding performance-based fees |
2 707 |
3.7 |
2 297 |
3.7 |
4 508 |
3.8 |
|
Performance-based fees to external managers |
796 |
483 |
718 |
|||
|
Management fee |
3 502 |
4.6 |
2 780 |
4.8 |
5 226 |
4.4 |
Management costs in subsidiaries
Management costs incurred in wholly-owned subsidiaries consist of costs related to the management of the investments in unlisted real estate and unlisted renewable energy infrastructure. These costs are expensed directly in the portfolio result and are not part of the management fee.
Management costs incurred in non-consolidated subsidiaries are presented in the income statement lines Income/expense from unlisted real estate and Income/expense from unlisted infrastructure. Management costs incurred in consolidated subsidiaries are presented in the income statement line Other income/expense. These costs are specified in table 11.2.
Table 11.2 Management costs subsidiaries
|
1H 2023 |
1H 2022 |
2022 |
||||
|---|---|---|---|---|---|---|
|
Amounts in NOK million |
Basis points |
Basis points |
Basis points |
|||
|
Salary, social security and other personnel-related costs |
17 |
15 |
30 |
|||
|
IT services, systems, data and information |
3 |
2 |
4 |
|||
|
Research, consulting and legal fees |
26 |
15 |
38 |
|||
|
Other costs |
27 |
23 |
42 |
|||
|
Total management costs subsidiaries1 |
72 |
0.1 |
55 |
0.1 |
114 |
0.1 |
|
Of which management costs non-consolidated subsidiaries |
45 |
35 |
71 |
|||
|
Of which management costs consolidated subsidiaries |
27 |
19 |
43 |
|||
1 Costs in the first half of 2023 comprised NOK 69 million related to investments in unlisted real estate and NOK 3 million related to investments in unlisted renewable energy infrastructure. For the first half of 2022, NOK 52 million was related to investments in unlisted real estate and NOK 3 million was related to investments in unlisted infrastructure.
Upper limit for reimbursement of management costs
Every year the Ministry of Finance establishes an upper limit for the reimbursement of management costs. Norges Bank is only reimbursed for costs incurred within this limit. Norges Bank is also reimbursed for performance-based fees to external managers. These fees are not measured against the upper limit.
For 2023, total management costs incurred in Norges Bank and its subsidiaries, excluding performance-based fees to external managers, are limited to NOK 6 200 million. In 2022, the limit was NOK 5 600 million.
At the end of the first half, management costs measured against the upper limit amounted to NOK 2 779 million. This consisted of management costs in Norges Bank, excluding performance-based fees to external managers, of NOK 2 707 million and management costs in subsidiaries of NOK 72 million. Total management costs including performance-based fees to external managers amounted to NOK 3 574 million.
Costs measured as a share of assets under management
Annualised costs are also measured in basis points, as a share of average assets under management. Average assets under management are calculated based on the market value of the portfolio in Norwegian kroner at the start of each month in the calendar year.
At the end of the first half, management costs incurred in Norges Bank and its subsidiaries, excluding performance-based fees to external managers, corresponded to 3.8 basis points of assets under management. Management costs including performance-based fees to external managers corresponded to 4.7 basis points of assets under management.
Other operating costs in subsidiaries
In addition to the management costs presented in table 11.2, other operating costs are also incurred in subsidiaries related to the ongoing maintenance, operation and development of the investments. These are not costs related to investing in real estate or renewable energy infrastructure but are costs of operating the underlying investments once they are acquired. Therefore, they are not defined as management costs. Other operating costs are expensed directly in the portfolio result and are not part of the management fee. They are also not included in the costs measured against the upper limit.
Other operating costs incurred in non-consolidated subsidiaries are presented in the income statement lines
Income/expense from unlisted real estate and Income/expense from unlisted infrastructure. For further information, see table 6.4 in note 6 Unlisted real estate and table 7.4 in note 7 Unlisted renewable energy infrastructure. Other operating costs incurred in consolidated subsidiaries are presented in the income statement line Other income/expense.
Auditor
Auditor's report
To the Supervisory Council of Norges Bank
Report on review of interim financial information
Introduction
We have reviewed the accompanying condensed balance sheet of the Government Pension Fund Global as of 30 June 2023 and the related condensed income statement, statement of changes in owner’s capital and statement of cash flows for the period 1 January 2023 to 30 June 2023. The Executive Board and management are responsible for the preparation and presentation of this interim financial information in accordance with IAS 34 Interim Financial Reporting. Our responsibility is to express a conclusion on this interim financial information based on our review.
Scope of review
We conducted our review in accordance with the international standard on review engagements 2410, ”Review of Interim Financial Information Performed by the Independent Auditor of the Entity”. A review of interim financial information consists of making inquiries, primarily of persons responsible for financial and accounting matters, and applying analytical and other review procedures. A review is substantially less in scope than an audit conducted in accordance with International Standards on Auditing and consequently does not enable us to obtain assurance that we would become aware of all significant matters that might be identified in an audit. Accordingly, we do not express an audit opinion.
Conclusion
Based on our review, nothing has come to our attention that causes us to believe that the accompanying interim financial information is not prepared, in all material respects, in accordance with IAS 34 Interim Financial Reporting.
Oslo, 10 August 2023
Ernst & Young AS
Kjetil Rimstad
State Authorized Public Accountant (Norway)