Investments
The fund’s market value fell 682 billion kroner to 11,657 billion kroner in the first half of 2022. A weaker krone cushioned the fall in the fund’s market value in krone terms. The fund’s return for the period was -14.4 percent, or -1,680 billion kroner. This was 1.14 percentage points better than the return on the benchmark index.

Equity investments had a market value of 7,986 billion at the end of the period, fixed-income investments 3,304 billion kroner, unlisted real estate investments 354 billion kroner and unlisted renewable energy infrastructure investments 13 billion kroner. Equities made up 68.5 percent of the fund, fixed income 28.3 percent, unlisted real estate 3.0 percent and unlisted renewable energy infrastructure 0.1 percent.
The change in the fund’s market value consists of the return of -1,680 billion kroner, less transfers from the government of 356 billion kroner and 642 billion from a weakening of the krone exchange rate.
The fund invests in international securities in foreign currency. Returns are therefore measured primarily in international currency – a weighted combination of the currencies in the fund’s benchmark indices for equities and bonds.
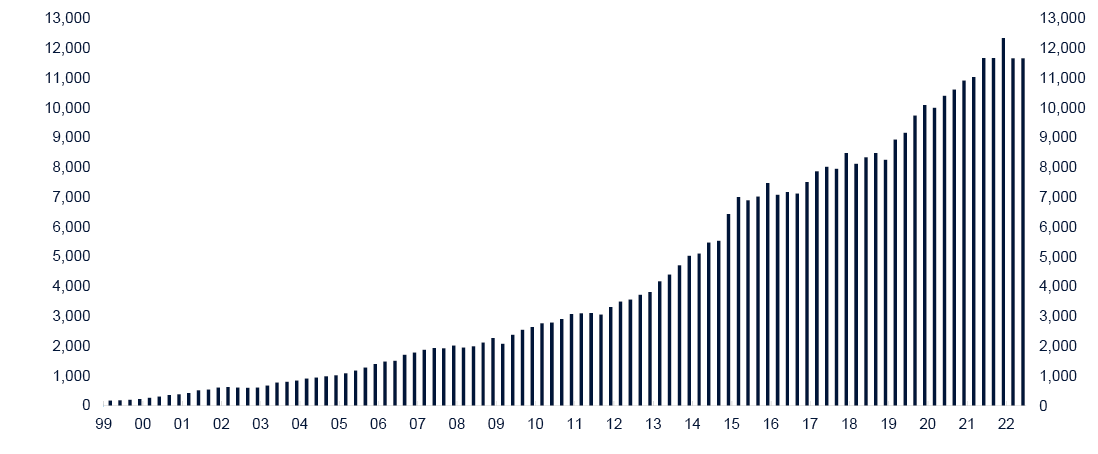
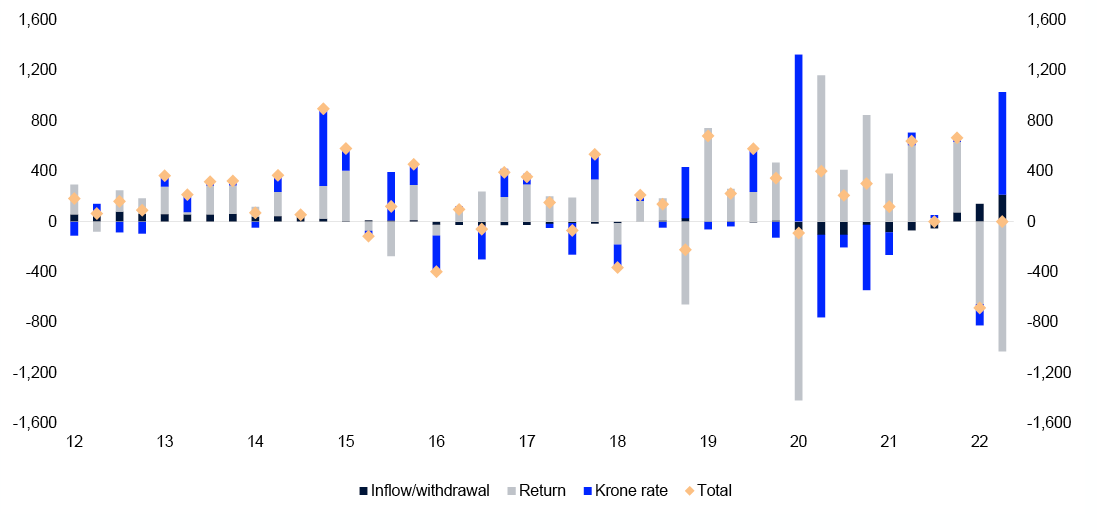
Table 1 Key figures. Billions of kroner.
|
First half 2022 |
1Q 2022 |
2021 |
|
|---|---|---|---|
|
Market value |
|||
|
Equity investments |
7,986 |
8,262 |
8,878 |
|
Fixed-income investments |
3,304 |
3,066 |
3,135 |
|
Unlisted real estate investments |
354 |
315 |
312 |
|
Unlisted infrastructure investments1 |
13 |
13 |
14 |
|
Market value of fund2 |
11,657 |
11,657 |
12,340 |
|
Accrued, not paid, management fees3 |
0 |
-2 |
1 |
|
Owner's capital2 |
11,657 |
11,655 |
12,340 |
|
Inflow of capital |
358 |
140 |
80 |
|
Withdrawal of capital |
- |
- |
-199 |
|
Paid management fees4 |
-2 |
1 |
-10 |
|
Return on fund |
-1,680 |
-653 |
1,580 |
|
Changes due to fluctuations in krone |
642 |
-171 |
-25 |
|
Total change in market value |
-682 |
-683 |
1,426 |
|
Changes in value since first capital inflow in 1996 |
|||
|
Total inflow of capital |
4,012 |
3,794 |
3,654 |
|
Total withdrawal of capital3 |
-687 |
-685 |
-687 |
|
Return on equity investments |
5,100 |
5,968 |
6,485 |
|
Return on fixed-income investments |
1,085 |
1,252 |
1,401 |
|
Return on unlisted real estate investments |
143 |
133 |
120 |
|
Return on unlisted infrastructure investments1 |
-0 |
1 |
1 |
|
Management fees4 |
-61 |
-60 |
-58 |
|
Changes due to fluctuations in krone |
2,066 |
1,252 |
1,423 |
|
Market value of fund |
11,657 |
11,657 |
12,340 |
|
Return on fund |
6,327 |
7,355 |
8,007 |
|
Return after management costs |
6,266 |
7,295 |
7,949 |
1 First unlisted infrastructure investment was made in second quarter of 2021.
2 The fund’s market value shown in this table does not take into account the management fee. Owner’s capital in the financial statements equals the fund’s market value less accrued, not paid, management fees.
3 Total withdrawal of capital shown in this table is adjusted for accrued, not paid, management fees.
4 Management fees are describe in note 11 in the financial statements.
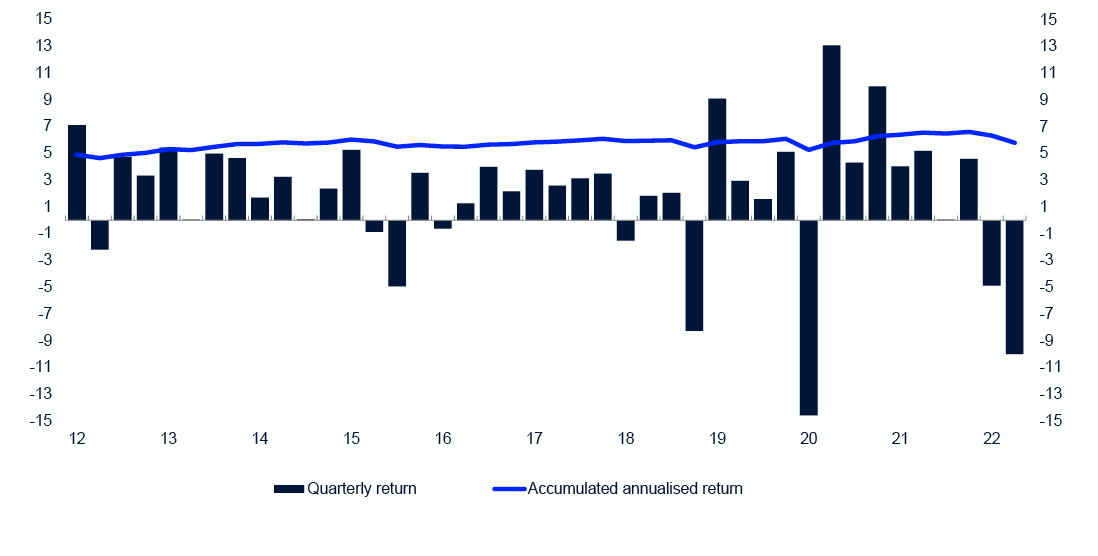
Table 2 Return figures. Measured in the fund's currency basket. Percent.
|
First half 2022 |
2Q 2022 |
1Q 2022 |
|
|---|---|---|---|
|
Equity investments |
-17.05 |
-12.49 |
-5.21 |
|
Fixed-income investments |
-9.32 |
-4.73 |
-4.81 |
|
Unlisted real estate investments |
7.12 |
2.87 |
4.13 |
|
Unlisted infrastructure investments |
-13.29 |
-10.30 |
-3.33 |
|
Return on fund |
-14.41 |
-10.01 |
-4.89 |
|
Management costs |
0.02 |
0.01 |
0.01 |
|
Return on fund after management costs |
-14.43 |
-10.02 |
-4.90 |
Table 3 Historical key figures as at 30 June 2022. Annualised data, measured in the fund's currency basket. Percent.
|
Since 01.01.1998 |
Last 10 years |
Last 12 months |
|
|---|---|---|---|
|
Fund return |
5.81 |
7.51 |
-10.43 |
|
Annual price inflation |
2.04 |
2.19 |
7.77 |
|
Annual management costs |
0.08 |
0.05 |
0.04 |
|
Net real return on fund |
3.62 |
5.15 |
-16.94 |
|
The fund's actual standard deviation |
8.12 |
8.52 |
9.82 |
Return on equity investments
The market in 2022 has been hit by rising interest rates, high inflation and war in Europe. The fund’s Russian equities were frozen following Russia’s invasion of Ukraine.
Equity investments returned -17.0 percent for the first half and accounted for 68.5 percent of the fund at the end of the period. Energy was the only sector with a positive return. The most negative returns were in technology, consumer durables and industry.
Energy stocks perform best
Energy companies delivered the period’s strongest return of 13.2 percent. Prices for oil, gas and refined products rose sharply as a result of stronger demand and low investment levels. The war between Russia and Ukraine put further pressure on prices.
Technology companies produced the period’s weakest return of -27.6 percent. The surge in demand during the pandemic for digital advertising, e-commerce and semiconductors has normalised. Growing fears of recession have also impacted particularly on tech stocks.
Consumer discretionary were the second-weakest sector in the first half with a return of -24.9 percent. These stocks had a difficult start to the year, with investors anticipating weaker demand from households in response to rapidly rising prices for essentials such as energy, housing and food.
Industrials were the third-weakest performers with a return of -21.8 percent. A weaker economy and fears of recession tend to reduce demand for industrial goods and services.
Table 4 Return on the fund's equity investments in first half of 2022. International currency. Percent.
|
Market |
Return |
Share of equity investments |
|---|---|---|
|
North America |
-17.6 |
46.4 |
|
Europe |
-19.3 |
29.2 |
|
Asia and Oceania |
-14.3 |
21.7 |
|
Emerging markets |
-12.6 |
11.2 |
Table 5 Return on the fund's equity investments in first half of 2022 by sector. International currency. Percent.
|
Sector |
Return |
Share of equity investments1 |
|---|---|---|
|
Basic materials |
-13.4 |
4.3 |
|
Consumer staples |
-8.5 |
6.5 |
|
Consumer discretionary |
-24.9 |
13.5 |
|
Financials |
-11.3 |
15.0 |
|
Health care |
-9.0 |
12.4 |
|
Industrials |
-21.8 |
12.5 |
|
Energy |
13.2 |
4.0 |
|
Technology |
-27.6 |
18.7 |
|
Telecommunications |
-6.5 |
3.6 |
|
Utilities |
-7.6 |
2.6 |
|
Real estate |
-19.0 |
6.2 |
1 Does not sum up to 100 percent because cash and derivatives are not included.
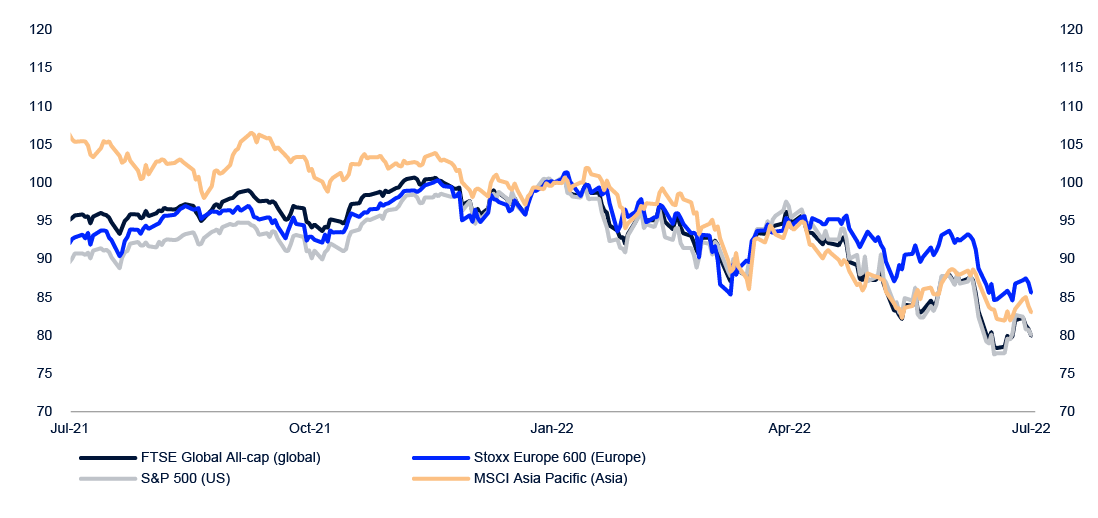
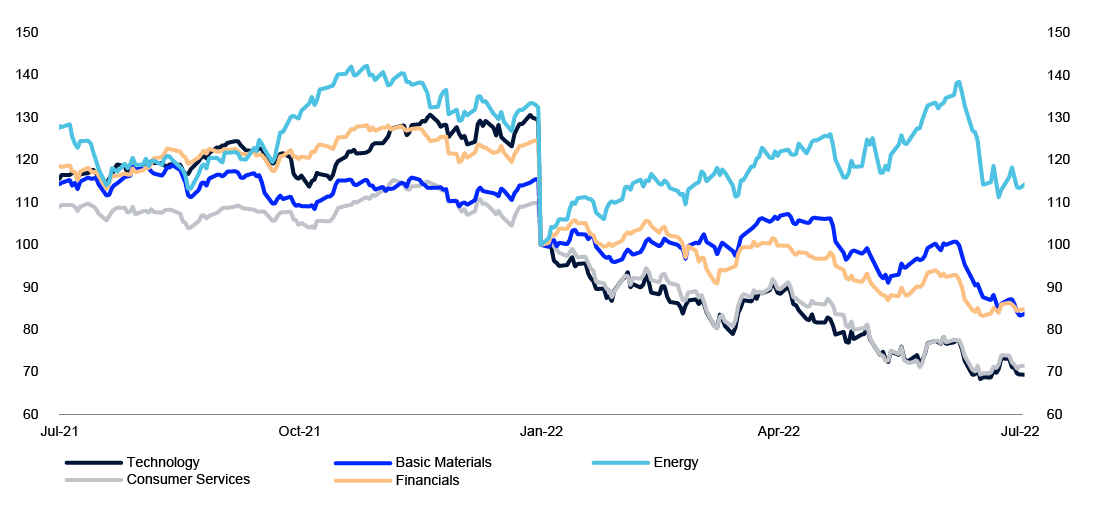
Table 6 The fund's largest equity holdings as at 30 June 2022. Millions of kroner.
|
Company |
Country |
Holding |
|---|---|---|
|
Apple Inc |
US |
204,480 |
|
Microsoft Corp |
US |
199,374 |
|
Alphabet Inc |
US |
128,392 |
|
Amazon.com Inc |
US |
95,165 |
|
Nestlé SA |
Switzerland |
84,613 |
|
Roche Holding AG |
Switzerland |
62,086 |
|
Taiwan Semiconductor Manufacturing Co Ltd |
Taiwan |
60,493 |
|
Shell PLC |
UK |
55,092 |
|
Tesla Inc |
US |
53,550 |
|
Meta Platforms Inc |
US |
53,101 |
|
AstraZeneca PLC |
UK |
46,080 |
|
Novo Nordisk A/S |
Denmark |
44,655 |
|
UnitedHealth Group Inc |
US |
44,511 |
|
Novartis AG |
Switzerland |
43,905 |
|
ASML Holding NV |
Netherlands |
43,089 |
|
Berkshire Hathaway Inc |
US |
41,865 |
|
Johnson & Johnson |
US |
40,653 |
|
Exxon Mobil Corp |
US |
37,673 |
|
Samsung Electronics Co Ltd |
South Korea |
37,658 |
|
NVIDIA Corp |
US |
35,921 |
Return on fixed-income investments
Fixed-income investments returned -9.3 percent for the first half and accounted for 28.3 percent of the fund at the end of the period. Returns in the bond market were unusually weak in the first half of 2022.
For example, Bloomberg’s US Treasury index returned -9.1 percent, the weakest half-year return since the index started in 1973. Excessive inflation was a key theme in the markets and led to a tightening of monetary policy and an increase in global interest rates.
Higher interest rates reduce value of bond portfolio
Government bonds returned -9.0 percent for the first half and accounted for 55.5 percent of the fund’s fixed-income investments at the end of the period. The fund’s three largest holdings were of US, Japanese and German government bonds.
US Treasuries accounted for 25.9 percent of fixed-income investments and returned -5.1 percent, while Japanese government bonds made up 10.3 percent of fixed-income investments and returned -14.0 percent, and euro-denominated government bonds amounted to 8.9 percent of fixed-income investments and returned -15.5 percent.
The Federal Reserve raised its policy rate by a total of 1.5 percentage points in the first half of the year. There was only a modest increase in interest rates in Japan, but the yen weakened considerably. In the euro area, higher interest rates and a weak euro brought a record-low half-year return.
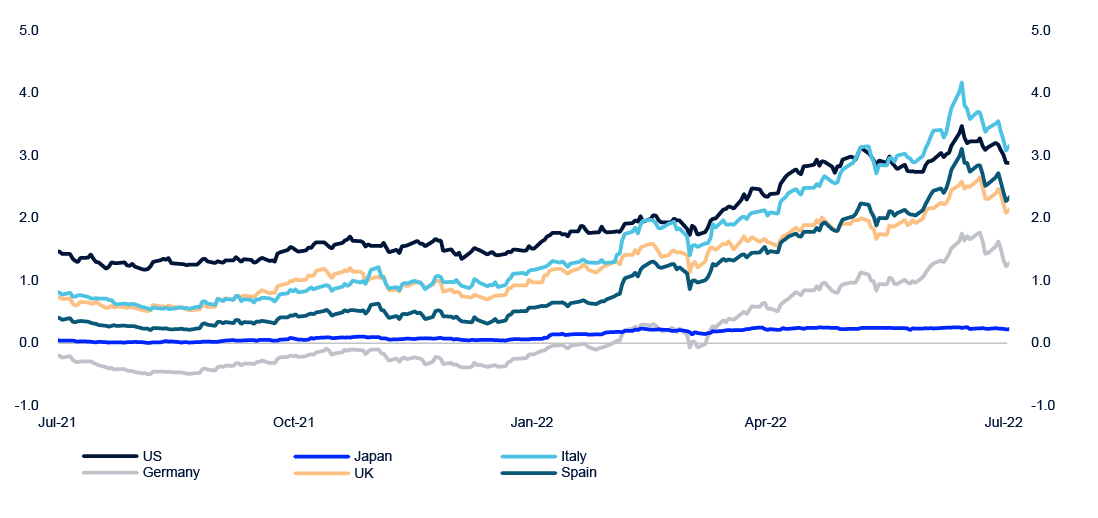
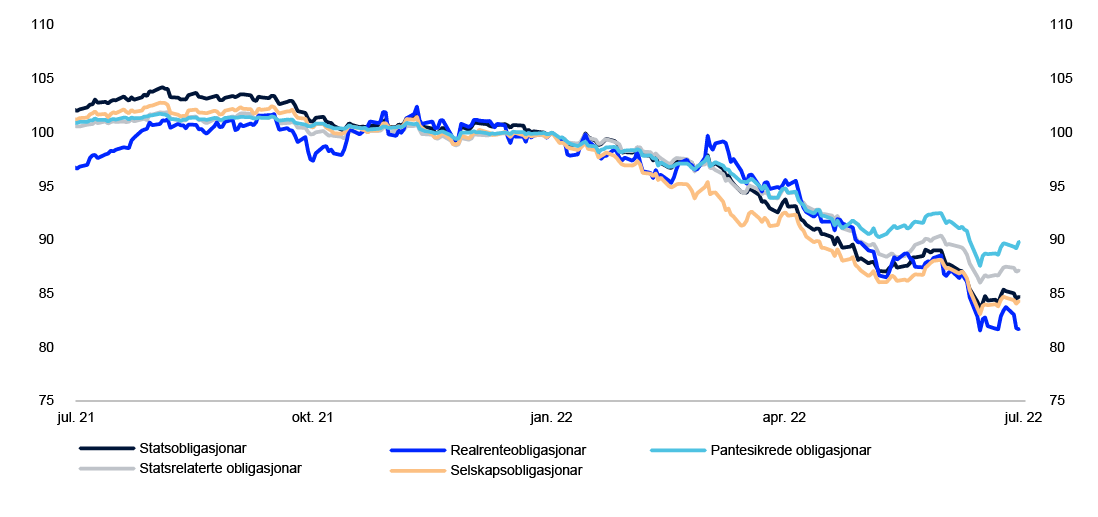
Table 7 Return on the fund's fixed-income investments in the first half of 2022 by sector. International currency. Percent.
|
Sector |
Return |
Share of fixed-income investments1 |
|---|---|---|
|
Government bonds2 |
-9.0 |
55.5 |
|
Government-related bonds2 |
-11.3 |
11.6 |
|
Inflation-linked bonds2 |
-10.1 |
6.6 |
|
Corporate bonds |
-11.0 |
23.8 |
|
Securitised bonds |
-9.3 |
6.8 |
1 Does not sum up to 100 percent because cash and derivatives are not included.
2 Governments may issue different types of bonds, and the fund's investments in these bonds are grouped accordingly. Bonds issued by a country's government in the country's own currency are categorised as government bonds. Bonds issued by a country's government in another country's currency are government-related bonds. Inflation-linked bonds issued by governments are grouped with inflation-linked bonds.
Table 8 The fund's largest bond holdings as at 30 June 2022. Millions of kroner.
|
Issuer |
Country |
Holding |
|---|---|---|
|
Government of United States of America |
US |
965,671 |
|
Government of Japan |
Japan |
347,006 |
|
Government of Germany |
Germany |
111,066 |
|
Monetary Authority of Singapore |
Singapore |
82,251 |
|
United Kingdom Government |
UK |
80,788 |
|
Government of France |
France |
58,194 |
|
Government of Canada |
Canada |
55,298 |
|
Government of Italy |
Italy |
50,388 |
|
Canada Mortgage & Housing Corp |
Canada |
40,959 |
|
Government of Spain |
Spain |
40,276 |
|
Government of Australia |
Australia |
39,724 |
|
European Union |
International Organisations |
27,675 |
|
Bank of America Corp |
US |
22,636 |
|
Government of South Korea |
South Korea |
21,366 |
|
Morgan Stanley |
US |
20,809 |
|
Kreditanstalt fur Wiederaufbau |
Germany |
18,835 |
|
Goldman Sachs Group Inc/The |
US |
18,660 |
|
Government of Singapore |
Singapore |
18,157 |
|
Government of the Netherlands |
Netherlands |
17,300 |
|
Government of Austria |
Austria |
16,990 |
Table 9 The fund's bond holdings as at 30 June 2022 based on credit ratings. Percentage of bond holdings.
|
AAA |
AA |
A |
BBB |
Lower |
Total |
|
|---|---|---|---|---|---|---|
|
Government bonds |
34.5 |
4.7 |
11.4 |
1.9 |
0.7 |
53.2 |
|
Government-related bonds |
4.8 |
4.1 |
1.6 |
0.5 |
0.1 |
11.1 |
|
Inflation-linked bonds |
4.2 |
1.5 |
0.2 |
0.4 |
- |
6.3 |
|
Corporate bonds |
0.2 |
1.6 |
9.8 |
10.8 |
0.4 |
22.8 |
|
Securitised bonds |
5.6 |
0.9 |
0.1 |
0.0 |
0.0 |
6.6 |
|
Total |
49.3 |
12.8 |
23.1 |
13.6 |
1.2 |
100.0 |
Return on real estate investments
Total real estate investments returned -5.7 percent for the first half and amounted to 5.0 percent of the fund at the end of the period. Unlisted and listed real estate investments are managed under a combined strategy for real estate.
Unlisted real estate investments returned 7.1 percent and accounted for 60.6 percent of the overall real estate portfolio, while investments in listed real estate returned -20.9 percent.
The main driver of returns in unlisted real estate is the investments in logistics, which was strong in the first half of 2022. The listed portfolio performed less well, as the market turmoil had a greater impact on this part of the real estate market.
Table 10 Value of real estate investments as at 30 June 2022. Millions of kroner.
|
Value1 |
|
|---|---|
|
Unlisted real estate investments |
353,895 |
|
Listed real estate investments |
230,291 |
|
Total real estate investments |
584,187 |
1 Inkludert bankinnskot og andre fordringar.
Table 11 Return on unlisted real estate investments in the first half of 2022. Percentage points.
|
Return |
|
|---|---|
|
Rental income |
1.5 |
|
Changes in value |
5.5 |
|
Transaction costs |
0.0 |
|
Result of currency adjustments |
0.1 |
|
Total |
7.1 |
Return on unlisted renewable energy infrastructure investments
Investments in unlisted renewable energy infrastructure returned -13.3 percent and amounted to 0.1 percent of the fund at the end of the period. The main driver of returns in unlisted renewable energy infrastructure was primarily due to an increased capital requirement as a result of higher interest rates, changes to expected future production and write-downs over the expected life of the project. The increase in power prices in the short term made a positive contribution to the return.
Table 12 Value of unlisted renewable energy infrastructure investments as at 30 June 2022. Millions of kroner.
|
Value1 |
|
|---|---|
|
Unlisted infrastructure investments |
13,061 |
1 Including bank deposits and other receivables.
Table 13 Return of unlisted renewable energy infrastructure investments in the first half of 2022. Percentage points.
|
Return |
|
|---|---|
|
Unlisted infrastructure investments |
-13.3 |
The fund’s relative return
The return on the fund for the first half of the year was 1.14 percentage points better than the return on the benchmark index from the Ministry of Finance, corresponding to an excess return of 156 billion kroner. This is the first time in two decades that we have generated an excess return in a sharply falling equity market. We do not expect a similarly strong relative return in the future.
The relative return is broken down between equity, fixed-income and real asset management, and an allocation effect between them.
Equity management contributed 0.31 percentage point to the fund’s relative return in the first half of the year. Investments in the energy sector made the most positive contribution to the relative return for the period, while the technology sector made the most negative. Broken down by country, equity investments in the US and the UK made the most positive contributions to the relative return, and Chinese stocks the most negative. An overweight of value stocks relative to the benchmark index contributed positively to the relative return.
Fixed-income management contributed 0.33 percentage point to the fund’s relative return for the period. The fund’s fixed-income investments have a lower duration than the benchmark index, which contributed positively to the relative return.
Real asset management contributed 0.42 percentage point to the fund’s relative return, measured against the equities and bonds sold to finance these investments. Listed real estate investments contributed -0.09 percentage point and unlisted real estate investments 0.51 percentage point, while infrastructure made a negligible contribution to the relative return for the period.
The relative return may also be affected by an allocation effect between these management areas. The contribution from this effect during the period was 0.07 percentage point, as the fund was underweight in equities relative to bonds.
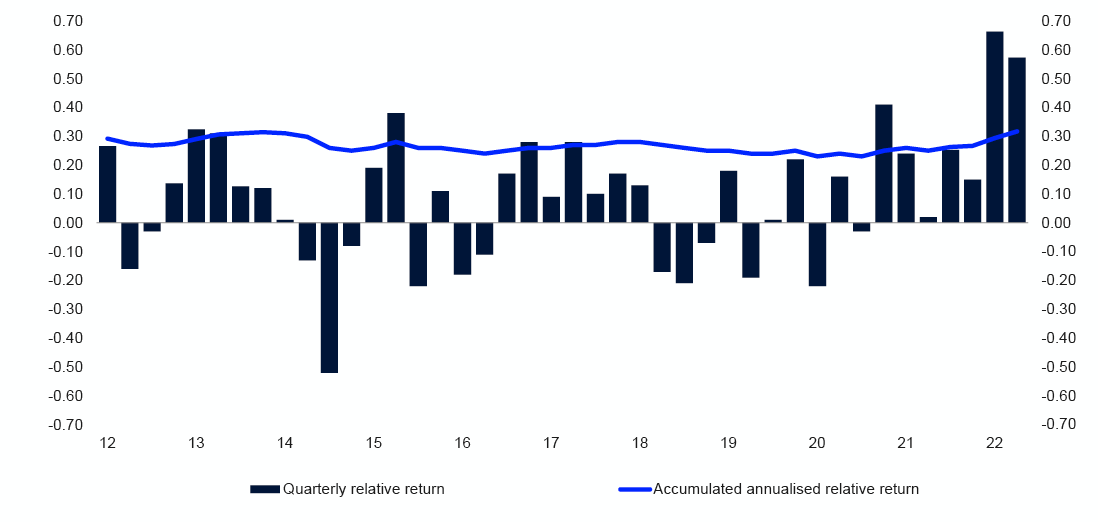
Table 14 Historic relative return as at 30 June 2022. Annualised figures measured in the fund's currency basket. Percentage points.
|
Since 1998 |
Last 15 years |
Last 10 years |
Last 5 years |
Last 12 months |
|
|---|---|---|---|---|---|
|
Relative return on fund (percentage points)1 |
0.32 |
0.20 |
0.38 |
0.50 |
1.54 |
|
The fund's tracking error (percentage points)1 |
0.65 |
0.77 |
0.38 |
0.38 |
0.47 |
|
The fund's information ratio (IR)1,2 |
0.50 |
0.29 |
0.96 |
1.24 |
3.63 |
1 Based on aggregated equity and fixed-income investments until end of 2016.
2 The fund's information ratio (IR) is the ratio of the fund's average monthly relative return to the fund's tracking error. The IR indicates how much relative return has been achieved per unit of relative risk.
Table 15 Contributions from management areas to the fund's relative return in the first half of 2022. Percentage points.
|
Total |
|
|---|---|
|
Equity management |
0.31 |
|
Fixed-income management |
0.33 |
|
Real assets management |
0.42 |
|
Allocation effect |
0.07 |
|
Total |
1.14 |
Investment framework
The fund is managed on the basis of limits set in the mandate from the Ministry of Finance.
Table 16 Key figures for the fund's risk and exposure.
|
Limits set by the Ministry of Finance |
30.06.2022 |
|
|---|---|---|
|
Allocation |
Equity portfolio 60–80 percent of fund's market value1 |
68.3 |
|
Unlisted real estate no more than 7 percent of the fund's market value |
3.0 |
|
|
Fixed-income portfolio 20–40 percent of fund's market value1 |
29.0 |
|
|
Unlisted renewable energy infrastructure no more than 2 percent of the fund's market value |
0.1 |
|
|
Market risk |
1.25 percentage points expected relative volatility for the fund's investments |
0.4 |
|
Credit risk |
Maximum 5 percent of fixed-income investments may be rated below BBB- |
1.2 |
|
Emerging markets |
Maximum 5 percent of fixed-income investments may be in emerging markets |
3.4 |
|
Ownership |
Maximum 10 percent of voting shares in a listed company in the equity portfolio2 |
9.6 |
1 Derivatives are represented with their underlying economic exposure.
2 Investments in listed and unlisted real estate companies are exempt from this restriction.
Operational risk management
Norges Bank’s Executive Board has decided there must be less than a 20 percent probability that operational risk factors will have a financial impact of 750 million kroner or more over a 12-month period.
Estimated operational risk exposure remained within the Executive Board’s tolerance limit in the first half of the year. A total of 152 unwanted operational events were registered, with an estimated financial impact of around 22.5 million kroner.
Responsible investment
Voting is one of the most important instruments available to us for exercising our ownership rights. We voted on a total of 96,317 proposals at 8,691 meetings in the first half of the year. The second quarter is the busy season for voting, with more than two thirds of annual shareholder meetings taking place between April and June. We continuously update all of our voting on our website: www.nbim.no.
We had 1,485 meetings with companies in the first half of the year, raising governance and sustainability issues at 68.4 percent of them. These issues mostly concerned capital management, climate change and human capital.
Financial reporting
|
Amounts in NOK million |
Note |
1H 2022 |
1H 2021 |
2021 |
|---|---|---|---|---|
|
Profit/loss on the portfolio before foreign exchange gain/loss |
||||
|
Income/expense from: |
||||
|
- Equities |
4 |
-1 383 671 |
1 035 066 |
1 593 618 |
|
- Bonds |
4 |
-339 903 |
-51 442 |
-40 905 |
|
- Unlisted real estate |
6 |
21 732 |
11 308 |
35 811 |
|
- Unlisted infrastructure |
7 |
-1 162 |
- |
1 198 |
|
- Financial derivatives |
4 |
21 271 |
-2 086 |
-4 839 |
|
- Secured lending |
2 008 |
1 843 |
3 842 |
|
|
- Secured borrowing |
-101 |
-19 |
21 |
|
|
Tax expense |
-563 |
-4 865 |
-8 887 |
|
|
Interest income/expense |
4 |
-11 |
-13 |
|
|
Other income/expense |
-13 |
10 |
11 |
|
|
Profit/loss on the portfolio before foreign exchange gain/loss |
-1 680 400 |
989 803 |
1 579 857 |
|
|
Foreign exchange gain/loss |
10 |
642 339 |
-78 706 |
-24 589 |
|
Profit/loss on the portfolio |
-1 038 061 |
911 097 |
1 555 269 |
|
|
Management fee |
11 |
-2 780 |
-2 668 |
-4 640 |
|
Profit/loss and total comprehensive income |
-1 040 841 |
908 430 |
1 550 628 |
|
Amounts in NOK million |
Note |
30.06.2022 |
31.12.2021 |
|---|---|---|---|
|
Assets |
|||
|
Deposits in banks |
32 134 |
18 450 |
|
|
Secured lending |
396 425 |
297 405 |
|
|
Cash collateral posted |
2 884 |
3 725 |
|
|
Unsettled trades |
79 577 |
15 767 |
|
|
Equities |
5 |
7 377 089 |
8 383 302 |
|
Equities lent |
5 |
575 805 |
505 117 |
|
Bonds |
5 |
2 996 733 |
2 795 536 |
|
Bonds lent |
5 |
449 622 |
623 367 |
|
Financial derivatives |
5 |
26 760 |
7 879 |
|
Unlisted real estate |
6 |
349 495 |
310 134 |
|
Unlisted infrastructure |
7 |
13 040 |
14 287 |
|
Withholding tax receivable |
8 957 |
3 427 |
|
|
Other assets |
3 986 |
1 860 |
|
|
Management fee receivable |
20 |
536 |
|
|
Total assets |
12 312 527 |
12 980 791 |
|
|
Liabilities and owner's capital |
|||
|
Secured borrowing |
478 880 |
591 960 |
|
|
Cash collateral received |
20 843 |
11 848 |
|
|
Unsettled trades |
138 045 |
22 607 |
|
|
Financial derivatives |
5 |
14 449 |
9 055 |
|
Deferred tax |
5 |
2 992 |
5 180 |
|
Other liabilities |
5 |
73 |
56 |
|
Total liabilities |
655 283 |
640 706 |
|
|
Owner's capital |
11 657 245 |
12 340 085 |
|
|
Total liabilities and owner's capital |
12 312 527 |
12 980 791 |
|
Amounts in NOK million, receipt (+) / payment (-) |
Note |
1H 2022 |
1H 2021 |
2021 |
|---|---|---|---|---|
|
Operating activities |
||||
|
Receipts of dividend from equities |
103 720 |
89 780 |
166 040 |
|
|
Receipts of interest from bonds |
24 789 |
23 714 |
46 449 |
|
|
Receipts of interest and dividend from unlisted real estate |
6 |
2 969 |
2 763 |
6 088 |
|
Receipts of interest and dividend from unlisted infrastructure |
7 |
96 |
- |
80 |
|
Net receipts of interest and fee from secured lending and borrowing |
1 939 |
1 782 |
3 883 |
|
|
Receipts of dividend, interest and fee from holdings of equities, bonds, unlisted real estate and unlisted infrastructure |
133 513 |
118 039 |
222 540 |
|
|
Net cash flow from purchase and sale of equities |
-157 205 |
364 662 |
495 674 |
|
|
Net cash flow from purchase and sale of bonds |
-157 636 |
-105 099 |
-646 867 |
|
|
Net cash flow to/from investments in unlisted real estate |
6 |
2 148 |
-406 |
-7 056 |
|
Net cash flow to/from investments in unlisted infrastructure |
7 |
373 |
-14 023 |
-13 375 |
|
Net cash flow financial derivatives |
27 844 |
-1 169 |
-542 |
|
|
Net cash flow cash collateral related to derivative transactions |
7 052 |
3 468 |
8 502 |
|
|
Net cash flow secured lending and borrowing |
-192 642 |
-204 237 |
74 976 |
|
|
Net payment of taxes |
-8 281 |
-6 866 |
-7 202 |
|
|
Net cash flow related to interest on deposits in banks and bank overdraft |
-5 |
-23 |
-42 |
|
|
Net cash flow related to other income/expense, other assets and other liabilities |
254 |
401 |
878 |
|
|
Settlement of management fee Norges Bank1 |
-2 264 |
-5 305 |
-10 481 |
|
|
Net cash inflow/outflow from operating activities |
-346 849 |
149 442 |
117 005 |
|
|
Financing activities |
||||
|
Inflow from the Norwegian government2 |
355 942 |
227 |
78 846 |
|
|
Withdrawal by the Norwegian government2 |
- |
-146 258 |
-199 000 |
|
|
Net cash inflow/outflow from financing activities |
355 942 |
-146 031 |
-120 154 |
|
|
Net change deposits in banks |
||||
|
Deposits in banks at 1 January |
18 450 |
18 258 |
18 258 |
|
|
Net increase/decrease of cash in the period |
9 094 |
3 411 |
-3 149 |
|
|
Net foreign exchange gain/loss on cash |
4 591 |
323 |
3 341 |
|
|
Deposits in banks at end of period |
32 134 |
21 992 |
18 450 |
1 Management fee shown in the Statement of cash flows for a period reflects the amount withdrawn or deposited to the krone account in connection with settlement of management costs incurred in Norges bank.
2 Inflows/withdrawals included here only represent transfers that have been settled in the period. Inflows/withdrawals in the Statement of changes in owner's capital are based on accrued inflows/withdrawals.
|
Amounts in NOK million |
Inflows from owner |
Retained earnings |
Total owner's capital |
|---|---|---|---|
|
1 January 2021 |
3 086 570 |
7 821 887 |
10 908 457 |
|
Profit/loss and total comprehensive income |
- |
908 430 |
908 430 |
|
Inflow during the period |
- |
- |
- |
|
Withdrawal during the period |
-147 000 |
- |
-147 000 |
|
30 June 2021 |
2 939 570 |
8 730 317 |
11 669 886 |
|
1 July 2021 |
2 939 570 |
8 730 317 |
11 669 886 |
|
Profit/loss and total comprehensive income |
- |
642 198 |
642 198 |
|
Inflow during the period |
80 000 |
- |
80 000 |
|
Withdrawal during the period |
-52 000 |
- |
-52 000 |
|
31 December 2021 |
2 967 570 |
9 372 515 |
12 340 085 |
|
1 January 2022 |
2 967 570 |
9 372 515 |
12 340 085 |
|
Profit/loss and total comprehensive income |
- |
-1 040 841 |
-1 040 841 |
|
Inflow during the period |
358 000 |
- |
358 000 |
|
Withdrawal during the period |
- |
- |
- |
|
30 June 2022 |
3 325 570 |
8 331 674 |
11 657 245 |
Notes
Note 1 General Information
Introduction
Norges Bank is Norway’s central bank. The bank is a separate legal entity and is owned by the state. Norges bank manages the Government Pension Fund Global (GPFG) on behalf of the Ministry of Finance, in accordance with section 3, second paragraph of the Government Pension Fund Act and the management mandate for the GPFG, issued by the Ministry of Finance.
The GPFG shall support government saving to finance future expenditure and underpin long-term considerations relating to the use of Norway’s petroleum revenues. The Norwegian Parliament has established the legal framework in the Government Pension Fund Act, and the Ministry of Finance has formal responsibility for the fund’s management. The Executive Board of Norges Bank has delegated day-to-day management of the GPFG to Norges Bank Investment Management (NBIM).
The Ministry of Finance has placed funds for investment in the GPFG in the form of a Norwegian krone deposit with Norges Bank (the krone account). Norges Bank manages the krone account in its own name by investing the funds in an investment portfolio consisting of listed equities, bonds, real estate and renewable energy infrastructure. The GPFG is invested in its entirety outside of Norway.
Transfers are made to and from the krone account in accordance with the management mandate. When the Norwegian State’s petroleum revenue exceeds the use of petroleum revenue in the fiscal budget, deposits will be made into the krone account. In the opposite situation, withdrawals will be made. Transfers to and from the krone account lead to a corresponding change in Owner’s capital.
Approval of the interim financial statements
The interim financial statements of Norges Bank for the first half of 2022, which only encompass the financial reporting for the GPFG, were approved by the Executive Board on 11 August 2022.
Note 2 Accounting policies
Basis of preparation
The Regulation on the financial reporting of Norges Bank (the Regulation), which has been laid down by the Ministry of Finance, requires that the financial reporting of the GPFG is prepared in accordance with International Financial Reporting Standards (IFRS) as adopted by the EU.
The condensed interim financial statements for the first half of 2022 are prepared in accordance with IAS 34 Interim Financial Reporting. The interim financial statements are presented in Norwegian kroner (NOK), rounded to the nearest million. Rounding differences may occur.
The interim financial statements are prepared using the same accounting policies and calculation methods as applied and disclosed in the annual report for 2021. The condensed interim financial reporting does not include all the information and disclosures required in annual financial statements and should therefore be read in conjunction with the annual report for 2021.
Significant estimates and accounting judgements
The preparation of the interim financial statements involves the use of uncertain estimates and assumptions relating to future events that affect the reported amounts for assets, liabilities, income and expenses. Estimates are based on historical experience and reflect management’s expectations about future events. Actual outcomes may deviate from estimates. The preparation of the interim financial statements also involves the use of judgement when applying accounting policies, which may have a significant impact on the financial statements.
In cases where there are particularly uncertain estimates or accounting judgements, this is described in the respective notes.
Note 3 Returns
Table 3.1 Returns
|
1H 2022 |
1H 2021 |
2021 |
|
|---|---|---|---|
|
Returns measured in the fund's currency basket (percent) |
|||
|
Return on equity investments |
-17.05 |
13.73 |
20.76 |
|
Return on fixed-income investments |
-9.32 |
-2.00 |
-1.94 |
|
Return on unlisted real estate investments |
7.12 |
4.59 |
13.64 |
|
Return on unlisted infrastructure investments1 |
-13.29 |
-1.93 |
4.15 |
|
Return on fund |
-14.41 |
9.42 |
14.51 |
|
Relative return on fund (percentage points) |
1.14 |
0.28 |
0.74 |
|
Returns measured in Norwegian kroner (percent) |
|||
|
Return on equity investments |
-11.19 |
12.70 |
20.67 |
|
Return on fixed-income investments |
-2.91 |
-2.90 |
-2.01 |
|
Return on unlisted real estate investments |
14.69 |
3.64 |
13.55 |
|
Return on unlisted infrastructure investments1 |
-7.16 |
0.13 |
7.24 |
|
Return on fund |
-8.36 |
8.42 |
14.42 |
1 The first investment in unlisted renewable energy infrastructure was completed on 31 May 2021. Therefore, all return figures for the asset class apply from June 2021.
For additional information on the calculation methods used when measuring returns, see note 3 Returns in the annual report for 2021.
Note 4 Income/expense from equities, bonds and financial derivatives
Tables 4.1 to 4.3 specify the income and expense elements for equities, bonds and financial derivatives, where the line Income/expense shows the amount recognised in profit or loss for the respective income statement line.
Table 4.1 Specification Income/expense from equities
|
Amounts in NOK million |
1H 2022 |
1H 2021 |
2021 |
|---|---|---|---|
|
Dividends |
114 063 |
95 665 |
170 556 |
|
Realised gain/loss |
151 303 |
359 173 |
652 455 |
|
Unrealised gain/loss |
-1 649 037 |
580 228 |
770 608 |
|
Income/expense from equities before foreign exchange gain/loss |
-1 383 671 |
1 035 066 |
1 593 618 |
Table 4.2 Specification Income/expense from bonds
|
Amounts in NOK million |
1H 2022 |
1H 2021 |
2021 |
|---|---|---|---|
|
Interest |
28 019 |
23 577 |
47 885 |
|
Realised gain/loss |
-58 224 |
-4 139 |
6 |
|
Unrealised gain/loss |
-309 698 |
-70 880 |
-88 796 |
|
Income/expense from bonds before foreign exchange gain/loss |
-339 903 |
-51 442 |
-40 905 |
Table 4.3 Specification Income/expense from financial derivatives
|
Amounts in NOK million |
1H 2022 |
1H 2021 |
2021 |
|---|---|---|---|
|
Interest |
5 780 |
-425 |
-877 |
|
Realised gain/loss |
7 703 |
-231 |
-2 223 |
|
Unrealised gain/loss |
7 788 |
-1 430 |
-1 738 |
|
Income/expense from financial derivatives before foreign exchange gain/loss |
21 271 |
-2 086 |
-4 839 |
Note 5 Holdings of equities, bonds and financial derivatives
Table 5.1 Equities
|
30.06.2022 |
31.12.2021 |
|||
|---|---|---|---|---|
|
Amounts in NOK million |
Fair value incl. accrued dividends |
Accrued dividends |
Fair value incl. accrued dividends |
Accrued dividends |
|
Equities |
7 952 894 |
14 953 |
8 888 419 |
7 353 |
|
Total equities |
7 952 894 |
14 953 |
8 888 419 |
7 353 |
|
Of which equities lent |
575 805 |
505 117 |
||
Table 5.2 Bonds
|
30.06.22 |
31.12.2021 |
|||||
|---|---|---|---|---|---|---|
|
Amounts in NOK million |
Nominal value |
Fair value incl. accrued interest |
Accrued interest |
Nominal value |
Fair value incl. accrued interest |
Accrued interest |
|
Government bonds |
1 953 787 |
1 834 517 |
7 208 |
1 855 432 |
1 914 848 |
5 585 |
|
Government-related bonds |
413 819 |
381 732 |
1 438 |
358 491 |
367 840 |
1 204 |
|
Inflation-linked bonds |
209 790 |
218 515 |
471 |
160 158 |
195 879 |
371 |
|
Corporate bonds |
864 711 |
785 348 |
6 484 |
714 041 |
748 389 |
5 542 |
|
Securitised bonds |
252 059 |
226 243 |
589 |
200 604 |
191 948 |
544 |
|
Total bonds |
3 694 167 |
3 446 355 |
16 190 |
3 288 727 |
3 418 903 |
13 246 |
|
Of which bonds lent |
449 622 |
623 367 |
||||
Financial derivatives
Financial derivatives such as foreign exchange derivatives, interest rate derivatives, credit derivatives and futures, are used to adjust the exposure in various portfolios as a cost-efficient alternative to trading in the underlying securities. Foreign exchange derivatives are also used in connection with liquidity management. Equity derivatives with an option component are often a result of corporate actions, and can be converted into equities or sold. The GPFG also uses equity swaps in combination with purchase and sale of equities. Equity swaps are not recognised in the balance sheet. See the accounting policy in note 13 Secured lending and borrowing in the annual report for 2021 for more information.
Table 5.3 specifies financial derivatives recognised in the balance sheet. Notional amounts are the basis for calculating any cash flows and gains/losses for derivative contracts. This provides information on the extent to which different types of financial derivatives are used.
Table 5.3 Financial derivatives
|
30.06.2022 |
31.12.2021 |
|||||
|---|---|---|---|---|---|---|
|
Amounts in NOK million |
Notional amount |
Fair value |
Notional amount |
Fair value |
||
|
Asset |
Liability |
Asset |
Liability |
|||
|
Foreign exchange derivatives |
602 889 |
12 016 |
4 515 |
791 724 |
5 920 |
5 278 |
|
Interest rate derivatives |
258 924 |
14 224 |
9 860 |
199 485 |
1 330 |
2 870 |
|
Credit derivatives |
38 358 |
36 |
18 |
29 563 |
164 |
902 |
|
Equity derivatives1 |
- |
227 |
- |
- |
349 |
- |
|
Exchange-traded futures contracts2 |
78 929 |
259 |
57 |
57 062 |
116 |
5 |
|
Total financial derivatives |
979 101 |
26 760 |
14 449 |
1 077 834 |
7 879 |
9 055 |
1 Notional amounts are not considered relevant for equity derivatives and are therefore not included in the table.
2 Exchange-traded futures contracts are settled daily with margin payments and fair value is normally zero at the balance sheet date, with the exception of futures contracts in certain markets where there is different timing for setting the market value for recognition in the balance sheet and daily margining.
Note 6 Unlisted real estate
Investments in unlisted real estate are made through subsidiaries of Norges Bank, exclusively established as part of the management of the GPFG. Subsidiaries presented as Unlisted real estate in the balance sheet are measured at fair value through profit or loss. The fair value of unlisted real estate is determined as the sum of the GPFG’s share of assets and liabilities in the underlying subsidiaries, measured at fair value. For further information, see note 2 Accounting policies and note 8 Fair value measurement in the annual report for 2021.
Income/expense, changes in carrying amounts and cash flows related to investments in unlisted real estate are specified in the tables below. See note 6 Unlisted real estate in the annual report for 2021 for further information on the principles applied in the tables.
Table 6.1 Income/expense from unlisted real estate
|
Amounts in NOK million |
1H 2022 |
1H 2021 |
2021 |
|---|---|---|---|
|
Payments of interest and dividend from unlisted real estate |
2 969 |
2 763 |
6 088 |
|
Unrealised gain/loss1 |
18 762 |
8 545 |
29 723 |
|
Income/expense from unlisted real estate before foreign exchange gain/loss |
21 732 |
11 308 |
35 811 |
1 Opptjente renter og utbytte som ikke er oppgjort er inkludert i Urealisert gevinst/tap.
Table 6.2 Changes in carrying amounts unlisted real estate
|
Amounts in NOK million |
30.06.2022 |
31.12.2021 |
|---|---|---|
|
Unlisted real estate at 1 January |
310 134 |
272 507 |
|
Net cash flow to/from investments in unlisted real estate |
-2 148 |
7 056 |
|
Unrealised gain/loss |
18 762 |
29 723 |
|
Foreign exchange gain/loss |
22 746 |
849 |
|
Unlisted real estate, closing balance for the period |
349 495 |
310 134 |
Table 6.3 specifies cash flows between the GPFG and subsidiaries presented as Unlisted real estate, related to ongoing operations and other activities.
Table 6.3 Cash flow unlisted real estate
|
Amounts in NOK million |
1H 2022 |
1H 2021 |
2021 |
|---|---|---|---|
|
Interest and dividend from ongoing operations |
2 582 |
2 712 |
6 037 |
|
Repayments of intercompany loans from ongoing operations |
652 |
790 |
1 692 |
|
Cash flow from ongoing operations unlisted real estate |
3 234 |
3 502 |
7 729 |
|
Payments for new investments |
-724 |
-1 626 |
-13 486 |
|
Payments for property development |
-415 |
-462 |
-866 |
|
Net payments external debt |
72 |
892 |
4 039 |
|
Repayments of intercompany loans from sales |
2 564 |
- |
1 565 |
|
Interest and dividend from sales |
388 |
51 |
51 |
|
Cash flow to/from other activities unlisted real estate |
1 884 |
-1 144 |
-8 697 |
|
Net cash flow unlisted real estate1 |
5 118 |
2 357 |
-968 |
1 Shown in the statement of cash flows as Receipts of interest and dividend from unlisted real estate and Net cash flow to/from investments in unlisted real estate. In the first half of 2022, this amounted to NOK 2 969 million and NOK 2 148 million, respectively (NOK 2 763 million and NOK -406 million in the first half of 2021).
Underlying real estate companies
Real estate subsidiaries have investments in other non-consolidated, unlisted companies. For further information, see note 16 Interests in other entities in the annual report for 2021.
Table 6.4 specifies the GPFG’s share of net income generated in the underlying real estate companies, which is the basis for Income/expense from unlisted real estate presented in table 6.1.
Table 6.4 Income from underlying real estate companies
|
Amounts in NOK million |
1H 2022 |
1H 2021 |
2021 |
|---|---|---|---|
|
Net rental income |
6 044 |
5 459 |
11 173 |
|
External asset management – fixed fees |
-525 |
-369 |
-819 |
|
External asset management – variable fees |
-13 |
3 |
-30 |
|
Internal asset management – fixed fees1 |
-47 |
-42 |
-84 |
|
Operating costs in wholly-owned subsidiaries2 |
-32 |
-30 |
-63 |
|
Operating costs in joint ventures |
-68 |
-47 |
-109 |
|
Interest expense external debt |
-320 |
-308 |
-673 |
|
Tax expense |
-123 |
-106 |
-253 |
|
Net income from ongoing operations |
4 916 |
4 561 |
9 141 |
|
Realised gain/loss |
767 |
47 |
424 |
|
Unrealised gain/loss3 |
16 155 |
6 761 |
26 387 |
|
Realised and unrealised gain/loss |
16 922 |
6 808 |
26 811 |
|
Transaction costs and fees from purchases and sales |
-106 |
-61 |
-141 |
|
Net income underlying real estate companies |
21 732 |
11 308 |
35 811 |
1 Internal asset management is carried out on 100 percent owned properties by employees in a wholly-owned, consolidated subsidiary.
2 Operating costs in wholly-owned subsidiaries are measured against the upper limit from the Ministry of Finance, see note 11 Management costs for more information.
3 Unrealised gain/loss presented in table 6.1 includes net income in the underlying real estate companies which is not distributed back to the GPFG, and will therefore not correspond to Unrealised gains/loss presented in table 6.4.
Table 6.5 specifies the GPFG’s share of assets and liabilities in the underlying real estate companies, which comprises the closing balance for Unlisted real estate presented in table 6.2.
Table 6.5 Assets and liabilities underlying real estate companies
|
Amounts in NOK million |
30.06.2022 |
31.12.2021 |
|---|---|---|
|
Properties |
375 772 |
336 332 |
|
External debt |
-22 663 |
-22 780 |
|
Net other assets and liabilities1 |
-3 614 |
-3 417 |
|
Total assets and liabilities underlying real estate companies |
349 495 |
310 134 |
1 Net other assets and liabilities comprise cash, tax and operational receivables and liabilities.
Agreements for purchases and sales of real estate
Table 6.6 provides an overview of announced agreements for purchases and sales of properties which are not completed at the balance sheet date.
Table 6.6 Announced agreements for purchases and sales of properties1
|
Type |
Property address |
City |
Ownership percent |
Currency |
Price in stated currency (million)2 |
Quarter announced |
Expected completion |
|---|---|---|---|---|---|---|---|
|
Purchase |
Potsdamer Straße 4 |
Berlin |
50.0 |
EUR |
1 354 |
2Q 2022 |
3Q 2022 |
1 Purchases and sales above USD 100 million are announced.
2 The stated price is for the GPFG's share.
Norges Bank also entered into agreements in 2019 to acquire a 48 percent interest in two to-be-constructed buildings in New York, at 561 Greenwich Street and 92 Avenue of the Americas, with expected completion in 2023 and 2024 respectively. The buildings will be purchased and the final purchase price determined upon completed construction.
Note 7 Unlisted renewable energy infrastructure
Investments in unlisted renewable energy infrastructure (Unlisted infrastructure) are made through subsidiaries of Norges Bank, exclusively established as part of the management of the GPFG. Subsidiaries presented as Unlisted infrastructure in the balance sheet are measured at fair value through profit or loss. For principles on recognition and measurement of subsidiaries, see note 2 Accounting policies in the annual report for 2021.
Income/expense, changes in carrying amounts and cash flow related to investments in unlisted infrastructure are specified in the tables below. The first investment in unlisted infrastructure was completed on 31 May 2021. See note 7 Unlisted renewable energy infrastructure in the annual report for 2021 for further information on the principles applied in the tables.
Table 7.1 Income/expense from unlisted infrastructure
|
Amounts in NOK million |
1H 2022 |
1H 2021 |
2021 |
|---|---|---|---|
|
Payments of interest and dividend from unlisted infrastructure |
96 |
- |
80 |
|
Unrealised gain/loss1 |
-1 257 |
- |
1 118 |
|
Income/expense from unlisted infrastructure before foreign exchange gain/loss |
-1 162 |
- |
1 198 |
1 Accrued interest and dividends which are not cash-settled are included in Unrealised gain/loss.
Table 7.2 Changes in carrying amounts unlisted infrastructure
|
Amounts in NOK million |
30.06.2022 |
31.12.2021 |
|---|---|---|
|
Unlisted infrastructure at 1 January |
14 287 |
- |
|
Net cash flow to/from investments in unlisted infrastructure |
-373 |
13 375 |
|
Unrealised gain/loss |
-1 257 |
1 118 |
|
Foreign exchange gain/loss |
383 |
-207 |
|
Unlisted infrastructure, closing balance for the period |
13 040 |
14 287 |
Table 7.3 specifies cash flows between the GPFG and subsidiaries presented as Unlisted infrastructure, related to ongoing operations and other activities.
Table 7.3 Cash flow unlisted infrastructre
|
Amounts in NOK million |
1H 2022 |
1H 2021 |
2021 |
|---|---|---|---|
|
Interest and dividend from ongoing operations |
96 |
- |
80 |
|
Repayments of intercompany loans from ongoing operations |
373 |
- |
648 |
|
Cash flow from ongoing operations unlisted infrastructure |
469 |
- |
728 |
|
Payments for new infrastructure investments |
- |
-14 023 |
-14 023 |
|
Cash flow to/from other activities unlisted infrastructure |
- |
-14 023 |
-14 023 |
|
Net cash flow unlisted infrastructure1 |
469 |
-14 023 |
-13 295 |
1 Shown in the statement of cash flows as Receipts of interest and dividend from unlisted infrastructure and Net cash flow to/from investments in unlisted infrastructure. In the first half of 2021, this amounted to NOK 96 million and NOK 373 million respectively (NOK 0 million and NOK -14 023 million in the first half of 2021).
Underlying infrastructure companies
Infrastructure subsidiaries have investments in other non-consolidated, unlisted companies. For further information, see note 16 Interests in other entities in the annual report for 2021.
Table 7.4 specifies the GPFG’s share of net income generated in the underlying infrastructure companies, which is the basis for Income/expense from unlisted infrastructure presented in table 7.1.
Table 7.4 Income from underlying infrastructure companies
|
Amounts in NOK million |
1H 2022 |
1H 2021 |
2021 |
|---|---|---|---|
|
Net income from sale of renewable energy |
1 143 |
17 |
747 |
|
Operating costs in wholly-owned subsidiaries1 |
-3 |
-1 |
-7 |
|
Operating costs in joint ventures |
-14 |
-1 |
9 |
|
Tax expense |
-140 |
- |
-160 |
|
Net income from ongoing operations |
985 |
15 |
589 |
|
Unrealised gain/loss2 |
-2 160 |
- |
639 |
|
Transaction costs and fees from purchases and sales |
14 |
-15 |
-31 |
|
Net income underlying infrastructure companies |
-1 162 |
- |
1 198 |
1 Operating costs in wholly-owned subsidiaries are measured against the upper limit from the Ministry of Finance, see note 11 Management costs for more information.
2 Unrealised gain/loss presented in table 7.1 includes net income in the underlying infrastructure companies which is not distributed back to the GPFG, and will therefore not correspond to Unrealised gains/loss presented in table 7.4.
Table 7.5 specifies the GPFG’s share of assets and liabilities in the underlying infrastructure companies, which comprises the closing balance for Unlisted infrastructure as presented in table 7.2.
Table 7.5 Assets and liabilities underlying infrastructure companies
|
Amounts in NOK million |
30.06.2022 |
31.12.2021 |
|---|---|---|
|
Wind farm |
12 498 |
14 290 |
|
Net other assets and liabilities1 |
542 |
-3 |
|
Total assets and liabilities underlying infrastructure companies |
13 040 |
14 287 |
1 Net other assets and liabilities comprise cash, tax and operational receivables and liabilities.
Note 8 Fair value measurement
Fair value for the majority of assets and liabilities is based on quoted market prices or observable market inputs. If the market is not active, fair value is established using standard valuation techniques. Estimating fair value can be complex and require the use of judgement, in particular when observable inputs are not available. For an overview of valuation models and techniques, as well as definitions and the classification in the three categories in the fair value hierarchy, see note 8 Fair value measurement in the annual report for 2021.
Significant estimate
Level 3 investments consist of instruments measured at fair value that are not traded or quoted in active markets. Fair value is determined using valuation techniques that use models with significant use of unobservable inputs. A considerable degree of judgement is applied in determining the assumptions that market participants would use when pricing the asset or liability, when observable market data is not available.
The fair value hierarchy
Table 8.1 Categorisation of the investment portfolio by level in the fair value hierarchy
|
Level 1 |
Level 2 |
Level 3 |
Total |
|||||
|---|---|---|---|---|---|---|---|---|
|
Amounts in NOK million |
30.06.2022 |
31.12.2021 |
30.06.2022 |
31.12.2021 |
30.06.2022 |
31.12.2021 |
30.06.2022 |
31.12.2021 |
|
Equities |
7 918 534 |
8 849 354 |
29 704 |
37 716 |
4 656 |
1 349 |
7 952 894 |
8 888 419 |
|
Government bonds |
1 549 663 |
1 494 936 |
284 854 |
419 912 |
- |
- |
1 834 517 |
1 914 848 |
|
Government-related bonds |
293 837 |
278 345 |
87 220 |
89 495 |
675 |
- |
381 732 |
367 840 |
|
Inflation-linked bonds |
198 818 |
177 457 |
19 697 |
18 422 |
- |
- |
218 515 |
195 879 |
|
Corporate bonds |
715 856 |
674 632 |
69 484 |
73 750 |
8 |
7 |
785 348 |
748 389 |
|
Securitised bonds |
194 801 |
162 737 |
31 442 |
29 211 |
- |
- |
226 243 |
191 948 |
|
Total bonds |
2 952 975 |
2 788 107 |
492 697 |
630 790 |
683 |
7 |
3 446 355 |
3 418 903 |
|
Financial derivatives (assets) |
183 |
246 |
26 577 |
7 633 |
- |
- |
26 760 |
7 879 |
|
Financial derivatives (liabilities) |
-18 |
- |
-14 431 |
-9 055 |
- |
- |
-14 449 |
-9 055 |
|
Total financial derivatives |
165 |
246 |
12 146 |
-1 422 |
- |
- |
12 311 |
-1 176 |
|
Unlisted real estate |
- |
- |
- |
- |
349 495 |
310 134 |
349 495 |
310 134 |
|
Unlisted infrastructure |
- |
- |
- |
- |
13 040 |
14 287 |
13 040 |
14 287 |
|
Other (assets)1 |
- |
- |
523 963 |
340 634 |
- |
- |
523 963 |
340 634 |
|
Other (liabilities)2 |
- |
- |
-640 833 |
-631 651 |
- |
- |
-640 833 |
-631 651 |
|
Total |
10 871 674 |
11 637 707 |
417 677 |
376 067 |
367 874 |
325 777 |
11 657 224 |
12 339 549 |
|
Total (percent) |
93.3 |
94.3 |
3.6 |
3.1 |
3.1 |
2.6 |
100.0 |
100.0 |
1 Other (assets) consists of the balance sheet lines Deposits in banks, Secured lending, Cash collateral posted, Unsettled trades (assets), Withholding tax receivable and Other assets.
2 Other (liabilities) consists of the balance sheet lines Secured borrowing, Cash collateral received, Unsettled trades (liabilities), Deferred tax and Other liabilities.
The majority of the total portfolio is priced based on observable market prices. At the end of the first half of 2022, 96.9 percent of the portfolio was classified as Level 1 or 2, which is a slight reduction compared to year-end 2021.
Equities
Measured as a share of total value, virtually all equities (99.57 percent) are valued based on official closing prices from stock exchanges and are classified as Level 1. A small share of equities (0.37 percent) are classified as Level 2. These are mainly equities for which trading has recently been suspended, or illiquid securities that are not traded daily. For a limited share of securities (0.06 percent) that are not listed, or where trading has been suspended and an adjustment has been applied to the last traded price, unobservable inputs are used to a significant extent in the fair value measurement. These holdings are therefore classified as Level 3.
Bonds
The majority of bonds (85.68 percent) have observable, executable market quotes in active markets and are classified as Level 1. The share of bonds classified as Level 2 was 14.30 percent. These are securities that do not have a sufficient number of observable quotes or that are priced based on comparable liquid bonds. A negligible share of holdings (0.02 percent) that do not have observable quotes are classified as Level 3, since the valuation is based on significant use of unobservable inputs.
Unlisted real estate and unlisted renewable energy infrastructure
All investments in unlisted real estate and unlisted renewable energy infrastructure are classified as Level 3, since models are used to value the underlying assets and liabilities, with extensive use of unobservable market inputs. All unlisted real estate and infrastructure investments are measured at the value determined by external valuers. Exceptions to this policy are newly acquired investments where the purchase price, excluding transaction costs, is normally considered to be the best estimate of fair value, or where there are indications that external valuation reports do not reflect fair value and adjustments to valuations are therefore warranted.
Financial derivatives
Some equity derivatives (rights and warrants) and credit derivatives (CDS indices) that are actively traded, are classified as Level 1. The majority of derivatives are classified as Level 2, since the valuation of these is based on standard models using observable market inputs.
Other assets and liabilities are classified as Level 2.
Movements between the levels in the hierarchy
Reclassifications between Level 1 and Level 2
The share of equity holdings classified as Level 1 increased marginally by 0.01 percentage point compared to year-end 2021. There were no significant reclassifications between Level 1 and Level 2 for equity holdings during the first half. The share of bond holdings classified as Level 1 increased by 4.13 percentage points compared to year-end 2021, with a corresponding decrease in the share of Level 2 holdings. The primary driver of this increase was the purchase of government bonds classified as Level 1 during the first half. There was also a net reclassification from Level 2 to Level 1 of NOK 9 billion in the first half, primarily due to improved liquidity for corporate bonds and government bonds.
Reclassifications between Level 1 and Level 3
Extensive sanctions were introduced on trading in Russian securities during the first half. As a result, there was limited price observability and equity securities were either suspended from trading or trading with restrictions. In order to estimate the price that would be received for the sale of the shares under current market conditions, a downward adjustment was applied to the last-traded price of these securities at the end of the first half. The adjustment reflects the estimated discount that market participants would demand to reflect the risk associated with the uncertainty inherent in the cash flows of the shareholdings, as well as the inability to access a public market to trade the shares. The adjustment to the last traded price is based on unobservable inputs and is considered to be significant to the fair value measurement. All equity holdings where an adjustment has been applied to the last traded price have therefore been reclassified to Level 3. At the end of the first half, these equity securities had a value of NOK 4 billion, compared to NOK 30 billion at year-end 2021.
Table 8.2 Changes in Level 3 holdings
|
Amounts in NOK million |
01.01.2022 |
Purchases |
Sales |
Settlements |
Net gain/loss |
Transferred into Level 3 |
Transferred out of Level 3 |
Foreign exchange gain/loss |
30.06.2022 |
|---|---|---|---|---|---|---|---|---|---|
|
Equities |
1 349 |
60 |
-905 |
-32 |
-36 885 |
30 465 |
-109 |
10 711 |
4 656 |
|
Bonds |
7 |
675 |
- |
- |
- |
- |
- |
1 |
683 |
|
Unlisted real estate1 |
310 134 |
-2 148 |
- |
- |
18 762 |
- |
- |
22 746 |
349 495 |
|
Unlisted infrastructure1 |
14 287 |
-373 |
- |
- |
-1 257 |
- |
- |
383 |
13 040 |
|
Total |
325 777 |
-1 786 |
-905 |
-32 |
-19 380 |
30 465 |
-109 |
33 841 |
367 874 |
|
Amounts in NOK million |
01.01.2021 |
Purchases |
Sales |
Settlements |
Net gain/loss |
Transferred into Level 3 |
Transferred out of Level 3 |
Foreign exchange gain/loss |
31.12.2021 |
|---|---|---|---|---|---|---|---|---|---|
|
Equities |
597 |
908 |
-16 |
- |
-327 |
242 |
-68 |
13 |
1 349 |
|
Bonds |
28 |
- |
- |
- |
-22 |
- |
- |
1 |
7 |
|
Financial derivatives (assets) |
4 |
- |
- |
- |
- |
- |
-4 |
- |
- |
|
Unlisted real estate1 |
272 507 |
7 056 |
- |
- |
29 723 |
- |
- |
849 |
310 134 |
|
Unlisted infrastructure1 |
- |
13 375 |
- |
- |
1 118 |
- |
- |
-207 |
14 287 |
|
Total |
273 136 |
21 339 |
-16 |
- |
30 492 |
242 |
-72 |
656 |
325 777 |
1 Purchases represent the net cash flow to investments in unlisted real estate and unlisted infrastructure, as presented in the Statement of cash flows.
The relative share of holdings classified as Level 3 was 3.1 percent at the end of the first half, which is a slight increase compared to year-end 2021. The GPFG’s aggregate holdings in Level 3 were NOK 367 874 million at the end of the first half, an increase of NOK 42 097 million compared to year-end. The increase is mainly due to investments in unlisted real estate, which are all classified as Level 3.
For both equities and bonds, the relative share classified as Level 3 has increased slightly compared to year-end. In absolute value, bonds classified as Level 3 have increased due to the purchase of one government-related bond classified as Level 3 during the first half. For equities, the increase in absolute value of Level 3 holdings is due to the reclassification of Russian equities from Level 1 to Level 3 during the first half.
Sensitivity analysis for Level 3 holdings
The valuation of Level 3 holdings involves the use of judgement when determining the assumptions that market participants would use when observable market data is not available.
Unlisted real estate investments constitute the vast majority of holdings classified as Level 3. The effect of using reasonable alternative assumptions for unlisted real estate investments is shown in the sensitivity analysis in table 8.3. For holdings of equities, bonds and unlisted infrastructure classified as Level 3, there are no significant changes to sensitivities compared to year-end 2021.
Table 8.3 Additional specification Level 3 and sensitivities - Unlisted real estate
|
Amounts in |
Key assumptions |
Change in key assumptions |
Specifi- cation of Level 3 holdings 30.06.2022 |
Sensitivities 30.06.2022 |
Specifi- cation of Level 3 holdings 31.12.2021 |
Sensitivities 31.12.2021 |
||
|---|---|---|---|---|---|---|---|---|
|
Unfavourable changes |
Favourable changes |
Unfavourable changes |
Favourable changes |
|||||
|
Unlisted real estate |
Yield |
0.2 percentage point |
-17 150 |
19 213 |
-15 219 |
17 050 |
||
|
Market rent |
2.0 percent |
-5 920 |
5 920 |
-5 253 |
5 253 |
|||
|
349 495 |
-23 070 |
25 133 |
310 134 |
-20 472 |
22 302 |
|||
Changes in key assumptions can have a material effect on the valuation of unlisted real estate investments. A number of key assumptions are used, of which yields and market rents are the assumptions that have the largest impact when estimating property values. This is illustrated in the sensitivity analysis by using other reasonable assumptions for yields and market rents. In an unfavourable outcome, an increase in the yield of 0.2 percentage point, and a reduction in market rents of 2 percent would result in a decrease in value of the unlisted real estate portfolio of approximately NOK 23 070 million or 6.6 percent (6.6 percent at year-end 2021). In a favourable outcome, a reduction in the yield of 0.2 percentage point and an increase in market rents of 2 percent would result in an increase in value of the unlisted real estate portfolio of approximately NOK 25 133 million or 7.2 percent (7.2 percent at year-end 2021). For unlisted real estate, changes in yields are a more significant factor for valuation than changes in market rents. The isolated effects of changes in yields and future market rents are presented in table 8.3.
Note 9 Investment risk
Investment risk comprises market risk, credit risk and counterparty risk. For further information on the framework for investment risk, including the main dimensions and measurement methods used to manage investment risk, see note 9 Investment risk in the annual report for 2021.
Market risk
Market risk is the risk of loss or a change in the market value of the portfolio, or parts of the portfolio, due to changes in financial market variables and in the unlisted real estate and unlisted infrastructure markets. Norges Bank Investment Management measures market risk both in absolute terms and relative to the benchmark.
Asset class by country and currency
The portfolio is invested across several asset classes, countries and currencies as shown in table 9.1.
Table 9.1 Allocation by asset class, country and currency
|
Market value in percent by country and currency1 |
Market value by asset |
Assets minus |
|||||||
|---|---|---|---|---|---|---|---|---|---|
|
Asset class |
Market |
30.06.2022 |
Market |
31.12.2021 |
30.06.2022 |
31.12.2021 |
30.06.2022 |
31.12.2021 |
|
|
Equities |
Developed |
88.7 |
Developed |
89.5 |
|||||
|
US |
44.6 |
US |
44.9 |
||||||
|
UK |
7.3 |
Japan |
7.0 |
||||||
|
Japan |
7.2 |
UK |
7.0 |
||||||
|
Switzerland |
4.7 |
France |
4.9 |
||||||
|
France |
4.5 |
Switzerland |
4.7 |
||||||
|
Total other |
20.4 |
Total other |
20.9 |
||||||
|
Emerging |
11.3 |
Emerging |
10.5 |
||||||
|
China |
4.3 |
China |
3.8 |
||||||
|
Taiwan |
2.2 |
Taiwan |
2.3 |
||||||
|
India |
1.8 |
India |
1.6 |
||||||
|
Brazil |
0.6 |
Brazil |
0.5 |
||||||
|
South Africa |
0.4 |
South Africa |
0.4 |
||||||
|
Total other |
2.1 |
Total other |
2.0 |
||||||
|
Total equities |
68.51 |
71.95 |
7 986 210 |
8 878 464 |
|||||
|
Fixed income |
Developed |
99.8 |
Developed |
99.6 |
|||||
|
US dollar |
52.6 |
US dollar |
50.3 |
||||||
|
Euro |
26.4 |
Euro |
27.6 |
||||||
|
Japanese yen |
7.6 |
Japanese yen |
7.9 |
||||||
|
British pound |
4.1 |
British pound |
4.9 |
||||||
|
Canadian dollar |
3.9 |
Canadian dollar |
3.8 |
||||||
|
Total other |
5.2 |
Total other |
5.0 |
||||||
|
Emerging2 |
0.2 |
Emerging |
0.4 |
||||||
|
Total fixed income |
28.34 |
25.41 |
3 304 058 |
3 135 259 |
|||||
|
Unlisted real estate |
US |
52.5 |
US |
50.1 |
|||||
|
UK |
16.3 |
UK |
17.8 |
||||||
|
France |
16.0 |
France |
17.1 |
||||||
|
Germany |
3.8 |
Germany |
3.9 |
||||||
|
Switzerland |
3.5 |
Switzerland |
3.6 |
||||||
|
Total other |
7.9 |
Total other |
7.4 |
||||||
|
Total unlisted real estate |
3.04 |
2.52 |
353 895 |
311 538 |
|||||
|
Total unlisted infrastructure |
0.11 |
0.12 |
13 061 |
14 288 |
|||||
1 Market value in percent per country and currency includes derivatives and cash.
2 The share of individual emerging market currencies in the fixed income portfolio is insignificant.
At the end of the first half, the equity portfolio’s share of the fund was 68.5 percent, compared to 72.0 percent at year-end 2021. The bond portfolio’s share of the fund was 28.3 percent, compared to 25.4 percent at year-end. The unlisted real estate portfolio’s share of the fund was 3.0 percent, compared to 2.5 percent at year-end. The share of unlisted infrastructure in the fund was 0.1 percent, the same as at year-end.
Volatility
Risk models are used to quantify the risk of value changes associated with all or parts of the portfolio. One of the risk measures is expected volatility. Volatility is a standard risk measure based on the statistical concept of standard deviation. Tables 9.2 and 9.3 present risk both in terms of the portfolio’s absolute risk and the relative risk. All the fund’s investments are included in the calculations of expected relative volatility, and are measured against the fund’s benchmark index consisting of global equity and bond indices. The fund’s management mandate specifies that expected relative volatility shall not exceed 1.25 percentage points.
Table 9.2 Portfolio risk, expected volatility, percent
|
Expected volatility, actual portfolio |
||||||||
|---|---|---|---|---|---|---|---|---|
|
30.06.2022 |
Min 2022 |
Max 2022 |
Average 2022 |
31.12.2021 |
Min 2021 |
Max 2021 |
Average 2021 |
|
|
Portfolio |
9.6 |
9.6 |
10.4 |
10.1 |
10.3 |
10.1 |
10.7 |
10.5 |
|
Equities |
13.8 |
13.8 |
14.4 |
14.2 |
14.1 |
14.0 |
14.7 |
14.4 |
|
Fixed income |
10.8 |
10.0 |
10.9 |
10.3 |
10.1 |
9.7 |
10.1 |
9.8 |
|
Unlisted real estate |
11.9 |
11.7 |
12.4 |
12.0 |
11.7 |
10.5 |
11.7 |
10.8 |
|
Unlisted infrastructure |
10.0 |
10.0 |
13.2 |
12.7 |
13.1 |
9.7 |
13.1 |
11.2 |
Table 9.3 Relative risk measured against the fund's benchmark index, expected relative volatility, basis points
|
Expected relative volatility |
||||||||
|---|---|---|---|---|---|---|---|---|
|
30.06.2022 |
Min 2022 |
Max 2022 |
Average 2022 |
31.12.2021 |
Min 2021 |
Max 2021 |
Average 2021 |
|
|
Portfolio |
43 |
42 |
53 |
48 |
50 |
42 |
56 |
47 |
Risk measured as expected volatility indicates an expected annual fluctuation in the value of the fund of 9.6 percent, or approximately NOK 1 120 billion at the end of the first half, compared to 10.3 percent at year-end 2021. Expected volatility for the equity portfolio was 13.8 percent at the end of the first half, down from 14.1 percent at year-end, while expected volatility for the bond portfolio was 10.8 percent, compared to 10.1 percent at year-end.
The fund’s expected relative volatility was 43 basis points at the end of the first half, compared to 50 basis points at year-end 2021. The decrease in the first half is primarily due to changes in exposures.
Expected shortfall is a tail risk measure that quantifies the expected loss of a portfolio in extreme market situations. Expected shortfall measured on relative returns provides an estimate of the annual expected relative underperformance versus the benchmark index for a given confidence level. Using historical simulations, relative returns of the current portfolio compared to the benchmark index are calculated on a weekly basis over a sampling period from January 2007 until the end of the last accounting period. The expected shortfall at a 97.5 percent confidence level is then given by the annualised average relative return, measured in the currency basket for the 2.5 percent worst weeks.
The Executive Board has determined that the fund shall be managed in such a way that the annual expected shortfall measured against the benchmark index does not exceed 3.75 percentage points. At the end of the first half, expected shortfall was 1.37 percentage points, compared to 1.52 percentage points at year-end 2021.
Credit risk
Credit risk is the risk of losses resulting from issuers of bonds defaulting on their payment obligations. Credit risk for the bond portfolio is monitored, among other things, through the use of credit ratings. Fixed-income instruments in the portfolio’s benchmark index are all rated investment grade by one of the major credit rating agencies.
Table 9.4 Bond portfolio specified by credit rating
|
Amounts in NOK million, |
AAA |
AA |
A |
BBB |
Lower rating |
Total |
|---|---|---|---|---|---|---|
|
Government bonds |
1 187 312 |
163 279 |
394 314 |
65 238 |
24 375 |
1 834 517 |
|
Government-related bonds |
166 983 |
140 900 |
55 032 |
16 631 |
2 186 |
381 732 |
|
Inflation-linked bonds |
144 257 |
51 714 |
7 839 |
14 705 |
- |
218 515 |
|
Corporate bonds |
7 231 |
53 774 |
338 490 |
372 596 |
13 258 |
785 348 |
|
Securitised bonds |
191 601 |
32 665 |
1 769 |
208 |
- |
226 243 |
|
Total bonds |
1 697 382 |
442 332 |
797 443 |
469 379 |
39 820 |
3 446 355 |
|
Amounts in NOK million, |
AAA |
AA |
A |
BBB |
Lower rating |
Total |
|---|---|---|---|---|---|---|
|
Government bonds |
1 186 701 |
183 432 |
443 812 |
78 790 |
22 113 |
1 914 848 |
|
Government-related bonds |
163 648 |
131 307 |
57 669 |
13 485 |
1 731 |
367 840 |
|
Inflation-linked bonds |
132 701 |
45 525 |
6 321 |
11 027 |
305 |
195 879 |
|
Corporate bonds |
6 433 |
52 623 |
303 970 |
372 433 |
12 930 |
748 389 |
|
Securitised bonds |
162 060 |
27 641 |
1 585 |
661 |
- |
191 948 |
|
Total bonds |
1 651 543 |
440 528 |
813 357 |
476 397 |
37 078 |
3 418 903 |
The share of bond holdings with credit rating AAA increased to 49.3 percent at the end of the first half, from 48.3 percent at year-end 2021. The increase in the AAA category is primarily due to increased holdings of securitised bonds. At the same time, the share of bond holdings with credit rating A fell to 23.1 percent at the end of the first half, from 23.8 percent at year-end. This is mainly due to reduced holdings of government bonds. The share of bond holdings in the Lower rating category increased to 1.2 percent at the end of the first half, from 1.1 percent at year-end. This is mainly due to a small increase in holdings of government bonds in this category. Overall, the credit quality of the bond portfolio has improved slightly since year-end.
Counterparty risk
Counterparty risk is the risk of loss due to counterparty bankruptcy or other events leading to counterparties defaulting.
Table 9.5 Counterparty risk by type of position
|
Risk exposure |
||
|---|---|---|
|
Amounts in NOK million |
30.06.2022 |
31.12.2021 |
|
Securities lending |
69 991 |
68 494 |
|
Derivatives including foreign exchange contracts |
56 647 |
61 144 |
|
Unsecured bank deposits1 and securities |
32 910 |
18 072 |
|
Repurchase and reverse repurchase agreements |
5 747 |
7 459 |
|
Settlement risk towards brokers and long-settlement transactions |
10 213 |
93 |
|
Total |
175 509 |
155 262 |
1 Includes bank deposits in non-consolidated subsidiaries.
Total counterparty risk exposure increased to NOK 175.5 billion at the end of the first half, from NOK 155.3 billion at year-end 2021. The increase in risk exposure is mainly due to higher unsecured bank deposits as well as higher risk exposure from settlement risk related to foreign exchange transactions. Counterparty risk exposure from securities lending accounted for 40 percent of the fund’s total counterparty risk exposure at the end of the first half. Both shares and bonds are lent out through the securities lending programme.
Note 10 Foreign exchange gains and losses
Accounting judgement
Gains and losses on financial instruments are due to changes in the price of the instrument (before foreign exchange gain/loss) and changes in foreign exchange rates (foreign exchange gain/loss). These are presented separately in the income statement. The method used to allocate the total gain/loss in Norwegian kroner to a security element and a foreign exchange element is an estimate. Different methods may result in different allocations. For further information on the method used, see note 11 Foreign exchange gains and losses in the annual report for 2021.
The market value of the fund in Norwegian kroner is impacted by changes in foreign exchange rates. See table 9.1 in note 9 Investment risk for an overview of the allocation of the GPFG’s investments per asset class, country and currency. The change in the fund’s market value due to changes in foreign exchange rates is presented in table 10.1.
Table 10.1 Specification foreign exchange gain/loss
|
Amounts in NOK million |
1H 2022 |
1H 2021 |
2021 |
|---|---|---|---|
|
Foreign exchange gain/loss – USD/NOK |
474 222 |
20 021 |
104 202 |
|
Foreign exchange gain/loss – EUR/NOK |
60 803 |
-45 439 |
-77 636 |
|
Foreign exchange gain/loss – JPY/NOK |
-34 894 |
-46 279 |
-55 115 |
|
Foreign exchange gain/loss – GBP/NOK |
2 140 |
10 080 |
13 272 |
|
Foreign exchange gain/loss – CHF/NOK |
18 980 |
-10 777 |
-643 |
|
Foreign exchange gain/loss – other |
121 087 |
-6 311 |
-8 668 |
|
Foreign exchange gain/loss |
642 339 |
-78 706 |
-24 589 |
Note 11 Management costs
Management costs comprise all costs relating to the management of the fund. These are mainly incurred in Norges Bank, but management costs are also incurred in subsidiaries of Norges Bank, exclusively established as part of the management of the GPFG’s investments in unlisted real estate and unlisted renewable energy infrastructure.
Management costs in Norges Bank
The Ministry of Finance reimburses Norges Bank for costs incurred in connection with the management of the GPFG, in the form of a management fee. The management fee is equivalent to the actual costs incurred by Norges Bank, including performance-based fees to external managers, and is expensed in the income statement line Management fee. Costs included in the management fee are specified in table 11.1.
Table 11.1 Management fee
|
1H 2022 |
1H |
2021 |
||||
|---|---|---|---|---|---|---|
|
Amounts in NOK million |
Basis points |
Basis points |
Basis points |
|||
|
Salary, social security and other personnel-related costs1 |
770 |
672 |
1 102 |
|||
|
Custody costs |
242 |
251 |
468 |
|||
|
IT services, systems, data and information |
311 |
291 |
591 |
|||
|
Research, consulting and legal fees |
137 |
97 |
210 |
|||
|
Other costs |
117 |
125 |
232 |
|||
|
Allocated costs Norges Bank |
153 |
152 |
301 |
|||
|
Base fees to external managers |
567 |
525 |
896 |
|||
|
Management fee excluding performance-based fees |
2 297 |
3.7 |
2 113 |
3.7 |
3 801 |
3.3 |
|
Performance-based fees to external managers |
483 |
554 |
840 |
|||
|
Management fee |
2 780 |
4.8 |
2 668 |
4.6 |
4 640 |
4.0 |
1 2021 costs are reduced by NOK 265 million, due to a one-off accounting adjustment following a change in the method for accruing performance-based pay.
Management costs in subsidiaries
Management costs incurred in subsidiaries consist of costs related to the management of the investments in unlisted real estate and unlisted renewable energy infrastructure. These costs are expensed directly in the portfolio result and are not part of the management fee.
Management costs incurred in non-consolidated subsidiaries are presented in the income statement lines Income/expense from unlisted real estate and Income/expense from unlisted infrastructure. Management costs incurred in consolidated subsidiaries are presented in the income statement line Other income/expense. These costs are specified in table 11.2.
Table 11.2 Management costs subsidiaries
|
1 H 2022 |
1 H |
2021 |
||||
|---|---|---|---|---|---|---|
|
Amounts in NOK million |
Basis points |
Basis points |
Basis points |
|||
|
Salary, social security and other personnel-related costs |
15 |
15 |
29 |
|||
|
IT services, systems, data and information |
2 |
2 |
5 |
|||
|
Research, consulting and legal fees |
15 |
16 |
38 |
|||
|
Other costs |
23 |
19 |
41 |
|||
|
Total management costs subsidiaries |
55 |
0.1 |
52 |
0.1 |
113 |
0.1 |
|
Of which management costs non-consolidated subsidiaries |
35 |
31 |
69 |
|||
|
Of which management costs consolidated subsidiaries |
19 |
22 |
43 |
|||
Upper limit for reimbursement of management costs
Every year the Ministry of Finance establishes an upper limit for the reimbursement of management costs. Norges Bank is only reimbursed for costs incurred within this limit. Norges Bank is also reimbursed for performance-based fees to external managers. These fees are not measured against the upper limit.
For 2022, total management costs incurred in Norges Bank and its subsidiaries, excluding performance-based fees to external managers, are limited to NOK 5 600 million.
At the end of the first half, management costs measured against the upper limit amounted to NOK 2 352 million. This consists of management costs in Norges Bank, excluding performance-based fees to external managers, of NOK 2 297 million and management costs in subsidiaries of NOK 55 million. Management costs including performance-based fees to external managers amounted to NOK 2 835 million.
Costs measured as a share of assets under management
Costs are also measured in basis points, as a share of average assets under management. Average assets under management are calculated based on the market value of the portfolio in Norwegian kroner at the start of each month in the calendar year.
Management costs incurred in Norges Bank and its subsidiaries in the first half, excluding performance-based fees to external managers, corresponded to 3.8 basis points of assets under management. Management costs including performance-based fees to external managers corresponded to 4.9 basis points of assets under management.
Other operating costs in subsidiaries
In addition to the management costs presented in table 11.2, other operating costs are also incurred in subsidiaries related to the ongoing maintenance, operation and development of the investments. These are not costs related to investing in real estate or renewable energy infrastructure but are costs of operating the underlying investments once they are acquired. Therefore, they are not defined as management costs. Other operating costs are expensed directly in the portfolio result and are not part of the management fee. They are also not included in the costs measured against the upper limit.
Other operating costs incurred in non-consolidated subsidiaries are presented in the income statement lines Income/expense from unlisted real estate and Income/expense from unlisted infrastructure. See table 6.4 in note 6 Unlisted real estate and table 7.4 in note 7 Unlisted renewable energy infrastructure for further information. Other operating costs incurred in consolidated subsidiaries are presented in the income statement line Other income/expense.
Auditor
Auditor's report
To the Supervisory Council of Norges Bank
Report on review of interim financial information
Introduction
We have reviewed the balance sheet of the Government Pension Fund Global as of 30 June 2022 and the related income statement, statement of changes in owner’s capital and statement of cash flows for the six-month period then ended. The Executive Board and management are responsible for the preparation and presentation of this interim financial information in accordance with IAS 34 Interim Financial Reporting. Our responsibility is to express a conclusion on this interim financial information based on our review.
Scope of review
We conducted our review in accordance with the international standard on review engagements 2410, ”Review of Interim Financial Information Performed by the Independent Auditor of the Entity”. A review of interim financial information consists of making inquiries, primarily of persons responsible for financial and accounting matters, and applying analytical and other review procedures. A review is substantially less in scope than an audit conducted in accordance with International Standards on Auditing and consequently does not enable us to obtain assurance that we would become aware of all significant matters that might be identified in an audit. Accordingly, we do not express an audit opinion.
Conclusion
Based on our review, nothing has come to our attention that causes us to believe that the interim financial information is not prepared, in all material respects, in accordance with IAS 34 Interim Financial Reporting.
Oslo, 11 August 2022
Ernst & Young AS
Kjetil Rimstad
State Authorised Public Accountant (Norway)
This translation from Norwegian has been prepared for information purposes only.