1. Investments

The investments in the Government Pension Fund Global returned 5.7 percent in the first half of 2025. This was 0.05 percentage point less than the return on the benchmark index. The value of the fund decreased by 156 billion kroner during the period to 19,586 billion kroner.
The change in the fund’s value breaks down into an accounting return of 698 billion kroner, transfers from the government of 156 billion kroner after costs, and a negative contribution from a stronger krone of 1,010 billion kroner.
Equities made up 70.6 percent of the fund’s value at the end of the period, fixed income 27.1 percent, unlisted real estate 1.9 percent and unlisted renewable energy infrastructure 0.4 percent.
The fund is invested in international securities and unlisted real estate and infrastructure in foreign currency. Returns are measured primarily in international currency – a weighted combination of the currencies in the fund’s benchmark index for equities and bonds. Unless otherwise stated, the results in this report are measured in this currency basket.
TABLE 1 Key figures from the financial statements in billions of kroner.
|
First half 2025 |
First quarter 2025 |
2024 |
|
|---|---|---|---|
|
Market value |
|||
|
Equity investments |
13,841 |
12,972 |
14,113 |
|
Fixed-income investments |
5,311 |
5,125 |
5,253 |
|
Unlisted real estate investments |
365 |
358 |
364 |
|
Unlisted infrastructure investments1 |
84 |
80 |
25 |
|
Market value of investment portfolio2 |
19,602 |
18,536 |
19,755 |
|
Deferred tax |
-12 |
-9 |
-13 |
|
Accrued, not paid, management fees3 |
-4 |
-2 |
0 |
|
Fund value2 |
19,586 |
18,524 |
19,742 |
|
Inflow of capital |
160 |
78 |
409 |
|
Withdrawal of capital |
- |
- |
- |
|
Paid management fees4 |
0 |
0 |
-7 |
|
Return on fund5 |
698 |
-415 |
2,511 |
|
Changes due to fluctuations in krone6 |
-1,010 |
-879 |
1,072 |
|
Changes due to accrued, not paid, management fees |
-4 |
-2 |
0 |
|
Total change in fund value |
-156 |
-1,217 |
3,985 |
|
Changes in value since first capital inflow in 1996 |
|||
|
Total inflow of capital |
6,024 |
5,942 |
5,864 |
|
Total withdrawal of capital3 |
-687 |
-687 |
-687 |
|
Return on equity investments5 |
10,332 |
9,290 |
9,786 |
|
Return on fixed-income investments5 |
1,394 |
1,324 |
1,252 |
|
Return on unlisted real estate investments5 |
76 |
74 |
67 |
|
Return on unlisted infrastructure investments1,5 |
4 |
2 |
2 |
|
Management fees4 |
-81 |
-80 |
-77 |
|
Accumulated fluctuations in krone |
2,536 |
2,668 |
3,547 |
|
Accumulated deferred tax7 |
-12 |
-9 |
-12 |
|
Fund value |
19,586 |
18,524 |
19,742 |
|
Return on fund |
11,793 |
10,680 |
11,095 |
|
Return after management costs |
11,712 |
10,601 |
11,017 |
1 First unlisted infrastructure investment was made in the second quarter of 2021.
2 The market value of the investment portfolio is presented before management fee payable/receivable and deferred tax.
3 Total inflow and withdrawal of capital shown in this table is not adjusted for accrued, not paid, management fees.
4 Management fees are described in note 11 in the financial statements.
5 Fund return of 698 billion kroner includes the accounting effect of changes in recognised deferred tax. The return on the investment portfolios excludes deferred tax and amounted to 699 billion kroner.
6 See note 10 Foreign exchange gains and losses in the financial statements.
7 Does not include the effect of exchange rate fluctuations on deferred tax.
CHART 1 Quarterly development in the market value of the investment portfolio in billions of kroner.
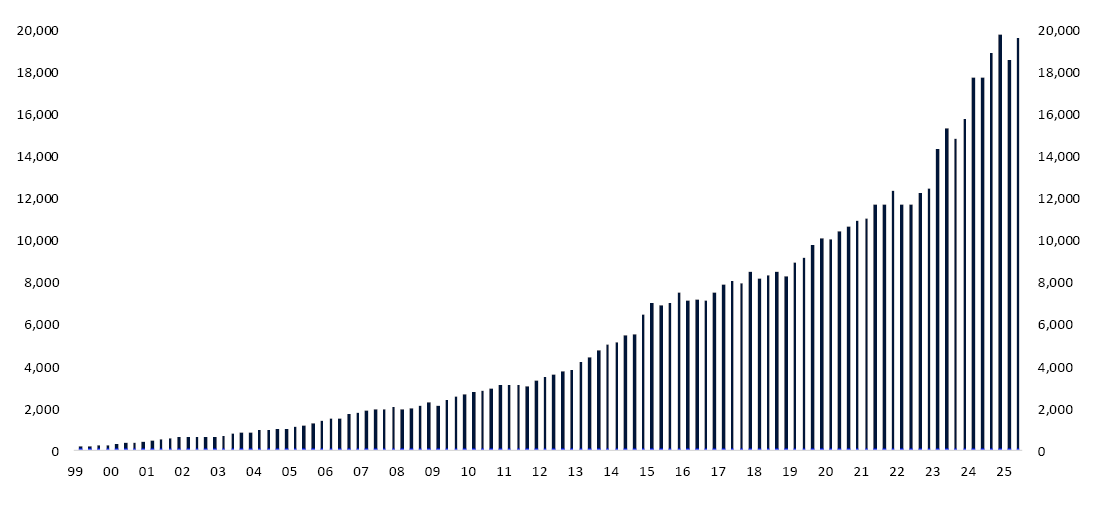
CHART 2 Quarterly changes in the market value of the investment portfolio in billions of kroner.
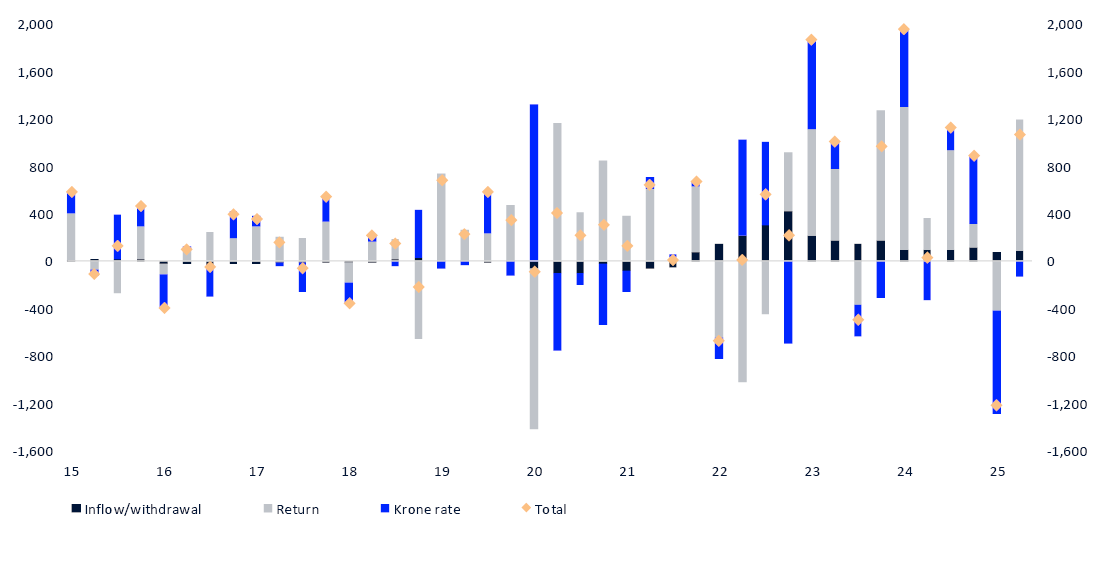
CHART 3 The fund’s quarterly return and accumulated annualised return in percent.
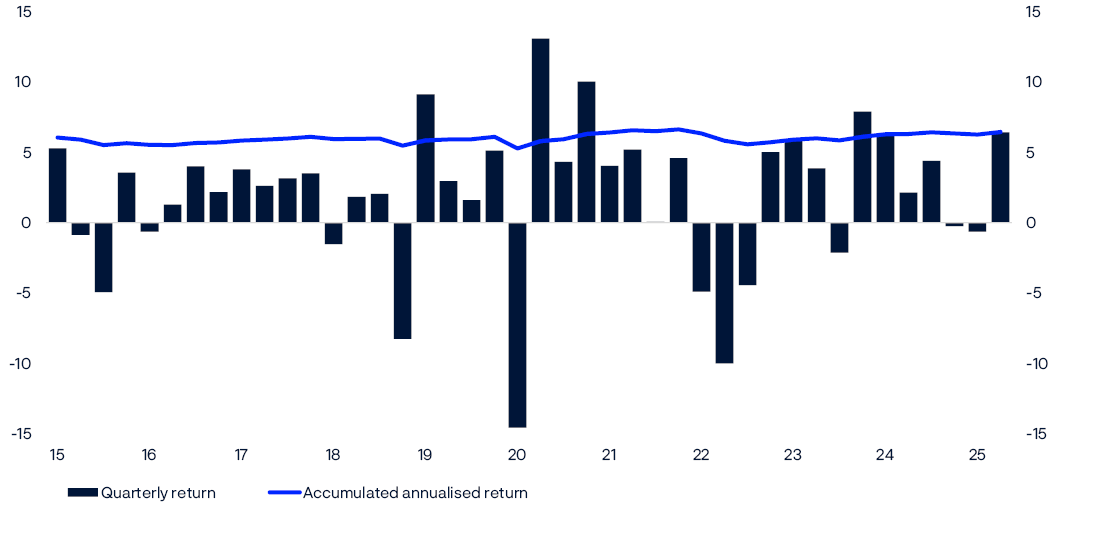
TABLE 2 Return figures in percent. Measured in the fund's currency basket.
|
First half 2025 |
Second quarter 2025 |
First quarter 2025 |
|
|---|---|---|---|
|
Equity investments |
6.73 |
8.45 |
-1.59 |
|
Fixed-income investments |
3.31 |
1.67 |
1.61 |
|
Unlisted real estate investments |
4.02 |
1.59 |
2.39 |
|
Unlisted infrastructure investments |
9.43 |
8.10 |
1.23 |
|
Return on fund |
5.74 |
6.42 |
-0.64 |
|
Management costs |
0.02 |
0.01 |
0.01 |
|
Return on fund after management costs |
5.72 |
6.41 |
-0.65 |
TABLE 3 Historical key figures in percent as at 30 June 2025. Annualised data, measured in the fund's currency basket.
|
Since 01.01.1998 |
Last 10 years |
Last 12 months |
|
|---|---|---|---|
|
Fund return |
6.44 |
7.39 |
10.12 |
|
Annual price inflation |
2.15 |
2.69 |
2.45 |
|
Annual management costs |
0.07 |
0.05 |
0.04 |
|
Net real return on fund |
4.12 |
4.53 |
7.45 |
|
The fund's actual standard deviation |
8.38 |
9.80 |
7.11 |
Return on equity investments
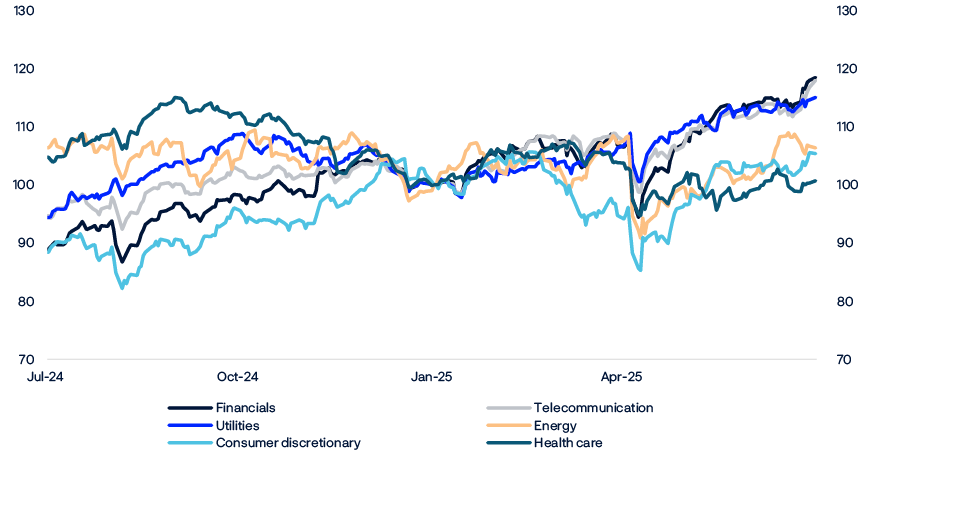
The fund’s equity investments had a strong first half, returning 6.7 percent for the period. Financials, telecoms and utilities were the strongest sectors, while health care produced the weakest return.
Financials perform best
Financials returned 16.5 percent in the first half of the year and accounted for 17.0 percent of the equity investments. European banks made the greatest contribution to this return, driven by expectations of increased public expenditure and further healthy profitability.
Telecoms returned 13.3 percent and amounted to 2.9 percent of the equity investments. The sector benefited from stable revenue streams, expectations of consolidation in Europe, and new sources of revenue in artificial intelligence.
Utilities returned 12.4 percent and made up 2.5 percent of the equity investments. Power producers and distributors contributed to this positive return, partly because investors sought more stable investments in a period of falling oil and gas prices.
Health care stocks returned -2.9 percent and amounted to 9.2 percent of the equity investments. Health care providers in particular lost value amid uncertainty around changes to US health care policy.
A full list of the fund’s equity investments can be found at www.nbim.no.
TABLE 4 Return on the fund's equity investments in first half of 2025. In percent. Measured in the fund's currency basket.
|
Market |
Return |
Share of equity investments |
|---|---|---|
|
North America |
1.4 |
57.7 |
|
Europe |
17.8 |
22.2 |
|
Asia and Oceania |
11.7 |
10.5 |
|
Emerging markets |
6.9 |
10.8 |
TABLE 5 Return on the fund's equity investments in first half of 2025. In percent. Measured in the fund's currency basket and sorted by sector.
|
Sector |
Return |
Share of equity investments1 |
|---|---|---|
|
Technology |
5.2 |
27.5 |
|
Financials |
16.5 |
17.0 |
|
Consumer Discretionary |
1.5 |
13.8 |
|
Industrials |
9.7 |
13.3 |
|
Health Care |
-2.9 |
9.2 |
|
Real Estate |
1.9 |
4.8 |
|
Consumer Staples |
4.3 |
4.5 |
|
Basic Materials |
8.0 |
3.1 |
|
Telecommunications |
13.3 |
2.9 |
|
Energy |
6.3 |
2.9 |
|
Utilities |
12.4 |
2.5 |
1 Does not sum up to 100 percent because cash and derivatives are not included.
CHART 4 Price developments in regional equity markets. Measured in US dollars. Indexed total return 31.12.2024 = 100. Source: Bloomberg.
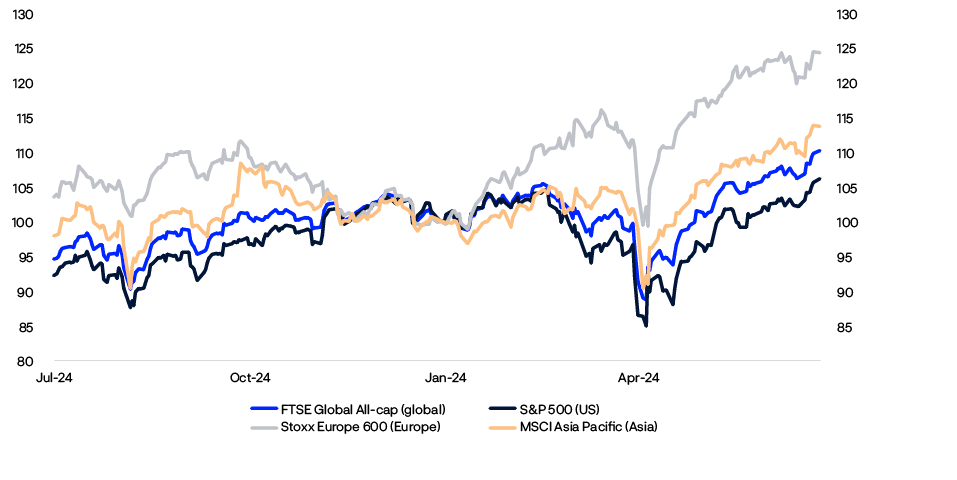
CHART 5 Price developments in the three sectors with the highest and weakest return in the FTSE Global All Cap index. Measured in dollars. Indexed total return 31.12.2024 = 100. Source: FTSE Russel.
Return on fixed-income investments
Fixed-income investments returned 3.3 percent in the first half of 2025. Increased political uncertainty led to considerable volatility in fixed-income markets. US Treasury yields declined somewhat during the period.
Exchange rates impact returns
Government bonds returned 2.5 percent for the period. The fund’s three largest holdings were of US, Japanese and German government bonds.
US Treasuries accounted for 31.4 percent of fixed-income investments and returned -0.4 percent. The Federal Reserve left its policy rate unchanged during the first half. Markets anticipate two rate cuts in the second half, but there is considerable uncertainty, particularly around trade policy. The marked fall in the dollar was a major contributor to the weak return.
Euro-denominated government bonds made up 11.2 percent of fixed-income investments and returned 8.3 percent. The European Central Bank cut its policy rate by a total of 1 percentage point during the period, taking it to 2 percent. The strong return was mainly the result of the euro appreciating.
Japanese government bonds amounted to 5.2 percent of fixed-income holdings and returned 1.6 percent. The Bank of Japan doubled its policy rate from 0.25 percent to 0.5 percent in January and has since left it unchanged. Yields on long Japanese government bonds have been unusually volatile and risen over time.
A full list of the fund’s fixed-income investments can be found at
www.nbim.no.
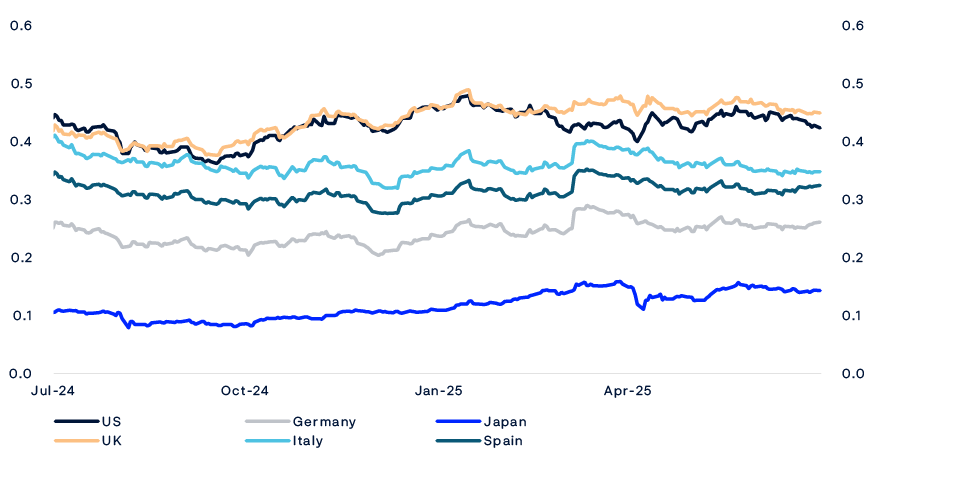
CHART 7 Price developments in fixed-income sectors. Measured in dollars. Indexed total return 31.12.2024 = 100. Source: Bloomberg Barclays Indices.
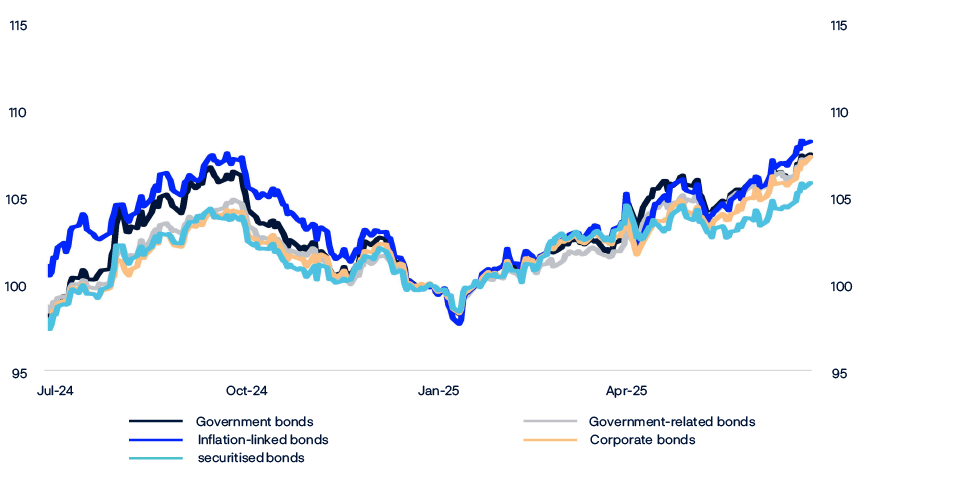
TABLE 6 Return on the fund's fixed-income investments in the first half of 2025. In percent. Measured in the fund's currency basket and sorted by sector.
|
Sector |
Return |
Share of fixed-income investments1 |
|---|---|---|
|
Government bonds2 |
2.5 |
57.9 |
|
Government-related bonds2 |
5.5 |
9.8 |
|
Inflation-linked bonds2 |
2.9 |
6.3 |
|
Corporate bonds |
2.9 |
24.9 |
|
Securitised bonds |
9.5 |
6.0 |
1 Does not sum up to 100 percent because cash and derivatives are not included.
2 Governments may issue different types of bonds, and the fund's investments in these bonds are grouped accordingly. Bonds issued by a country's government in the country's own currency are categorised as government bonds. Bonds issued by a country's government in another country's currency are government-related bonds. Inflation-linked bonds issued by governments are grouped with inflation-linked bonds.
Return on real estate investments
The fund’s total real estate investments returned 1.8 percent in the first half of the year and made up 3.6 percent of the fund at the end of the period. The fund’s real estate strategy covers both unlisted and listed real estate investments.
Investments in unlisted real estate made up 52 percent of the total real estate portfolio and returned 4.0 percent, while investments in listed real estate returned -0.5 percent.
The fund’s unlisted real estate investments are primarily in the office, retail and logistics segments. Values increased particularly in the European office and retail segments, thanks to the European Central Bank’s policy rate cuts and lower office vacancy rates, especially in London and Paris. In the US, where the policy rate was unchanged, developments were more mixed. Vacancy rates rose overall, but some markets showed signs of improvement. The fund’s listed real estate investments span a variety of sectors. Life sciences and cold storage contributed negatively to the return.
A full list of the fund’s real estate investments can be found at www.nbim.no.
TABLE 7 Value of real estate investments in millions of kroner as at 30 June 2025.
|
Value1 |
|
|---|---|
|
Unlisted real estate investments |
365,194 |
|
Listed real estate investments |
331,981 |
|
Total real estate investments |
697,175 |
1 Including bank deposits and other receivables.
TABLE 8 Return on unlisted real estate investments in the first half of 2025.
In percentage points.
|
Return |
|
|---|---|
|
Rental income |
2.0 |
|
Changes in value |
0.6 |
|
Transaction costs |
-0.1 |
|
Result of currency adjustments |
1.5 |
|
Total |
4.0 |
Return on unlisted renewable energy infrastructure investments
Investments in unlisted renewable energy infrastructure returned 9.4 percent in the first half of the year. The return on the portfolio comprises net income from power sales and changes in the value of the investments. The positive return was a result of favourable currency effects and income during the period. Besides projects already in operation, we have committed capital to future projects and projects under construction. These projects are expected to generate income in the future.
The fund made two new investments during the period. In March, the fund invested in a 49 percent interest in two offshore wind projects under construction in Denmark and Germany for 4,000 million euros, or around 45 billion kroner. The fund's investments in the projects includes future construction costs.
A full list of the fund’s unlisted renewable energy infrastructure investments can be found at www.nbim.no.
TABLE 9 Value of unlisted renewable energy infrastructure investments in millions of kroner as at 30 June 2025.
|
Value1 |
|
|---|---|
|
Unlisted infrastructure investments |
84,238 |
1 Including bank deposits and other receivables.
TABLE 10 Return on unlisted renewable energy infrastructure investments in the first half of 2025. In percent.
|
Return |
|
|---|---|
|
Unlisted infrastructure investments |
9.4 |
The fund’s relative return
The return on the fund for the first half of the year was 0.05 percentage point less than the return on the benchmark index from the Ministry of Finance, corresponding to a relative return of -10 billion kroner.
Equity management contributed 0.03 percentage point to the relative return for the period. Investments in technology and financials made the most positive contributions, while health care made the most negative.
Fixed-income management contributed 0.06 percentage point to the relative return. Investments in Europe contributed strongly to the relative return, as did those in emerging markets, where the fund has an allocation but the benchmark index does not.
Investments in real estate made the most negative contribution to the fund’s relative return, measured against the equities and bonds sold to fund them. Unlisted real estate investments contributed -0.04 percentage point. This weak performance was mainly attributable to investments in the logistics and office segments in the US. Listed real estate investments contributed -0.08 percentage point to the relative return.
Investments in renewable energy infrastructure made a negligible contribution to the relative return.
The relative return for the period was also affected by the fund having a lower allocation to equities and a higher allocation to bonds than the benchmark index did. The contribution from this effect was -0.02 percentage point.
CHART 8 The fund’s quarterly relative return and accumulated annualised relative return in percentage points. Calculations based on aggregated equity and fixed-income investments until end of 2016.
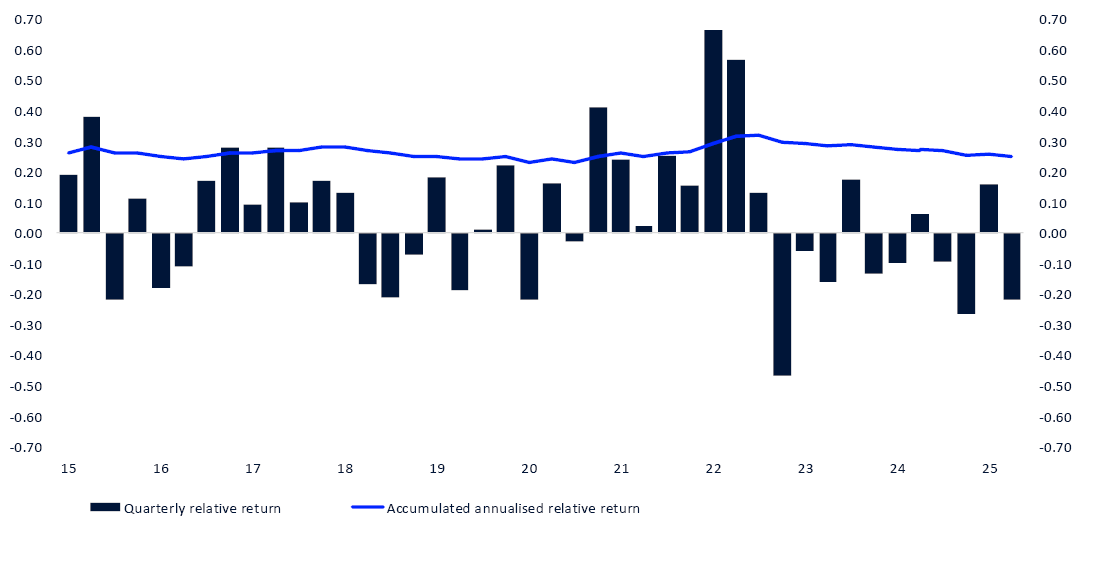
TABLE 11 Historic relative return in percentage points as at 30 June 2025. Annualised figures measured in the fund's currency basket.
|
|
Since 01.01.1998 |
Last 15 years |
Last 10 years |
Last 5 years |
Last 12 months |
|---|---|---|---|---|---|
|
Relative return on fund (percentage points)1 |
0.25 |
0.23 |
0.19 |
0.31 |
-0.45 |
|
The fund's tracking error (percentage points)1 |
0.63 |
0.39 |
0.39 |
0.45 |
0.27 |
|
The fund's information ratio (IR)1,2 |
0.40 |
0.55 |
0.45 |
0.58 |
-1.57 |
1 Based on aggregated equity and fixed-income investments until end of 2016.
2 The fund's information ratio (IR) is the ratio of the fund's average monthly relative return to the fund's tracking error. The IR indicates how much relative return has been achieved per unit of relative risk.
TABLE 12 Contributions from management areas to the fund's relative return in percentage points in the first half of 2025.
|
Total |
|
|---|---|
|
Equity management |
0.03 |
|
Fixed-income management |
0.06 |
|
Real assets management |
-0.12 |
|
Allocation effect |
-0.02 |
|
Total |
-0.05 |
The fund’s investment framework
The fund is managed on the basis of limits set in the mandate from the Ministry of Finance.
TABLE 13Key figures for the fund's risk and exposure.
|
Limits set by the Ministry of Finance |
30.06.2025 |
|
|---|---|---|
|
Allocation |
Equity portfolio 60–80 percent of fund's market value1 |
70.4 |
|
Unlisted real estate no more than 7 percent of the fund's market value |
1.9 |
|
|
Fixed-income portfolio 20–40 percent of fund's market value1 |
27.7 |
|
|
Unlisted renewable energy infrastructure no more than 2 percent of the fund's market value |
0.4 |
|
|
Market risk |
1.25 percentage points expected relative volatility for the fund's investments |
0.4 |
|
Credit risk |
Maximum 5 percent of fixed-income investments may be rated below BBB- |
1.3 |
|
Emerging markets |
Maximum 5 percent of fixed-income investments may be in emerging markets |
3.2 |
|
Ownership |
Maximum 10 percent of voting shares in a listed company in the equity portfolio2 |
9.7 |
1 Derivatives are represented with their underlying economic exposure.
2 Investments in listed and unlisted real estate companies are exempt from this restriction.
Information on risk and exposure in each asset class can be found at www.nbim.no.
Operational risk management
The Executive Board has decided that there must be less than a 20 percent probability that operational risk factors result in gains and losses totalling 1 billion kroner or more over a 12-month period. This is referred to as the Executive Board’s operational risk tolerance.
Estimated operational risk exposure remained within the Executive Board’s tolerance limit in the first half of the year. A total of 85 unwanted operational events were registered, with an estimated financial impact of around 58 million kroner.
Responsible investment
The first half of the year is the busy season for voting at the companies in which the fund is invested, with more than two thirds of these companies’ annual shareholder meetings taking place between April and June. Voting is one of the most important instruments available to us for exercising our ownership rights. We voted on a total of 87,399 proposals at 7,936 shareholder meetings in the first half of 2025. All of our voting is continuously updated at www.nbim.no. We also publish a summary of our voting in the first half of each year.
We had 1,427 meetings with companies during the period, raising governance and sustainability issues at 55.4 percent of them. These issues mostly concerned capital management, climate change and human capital.
2. Financial statements
Income statement
|
Amounts in NOK million |
Note |
1H 2025 |
1H 2024 |
2024 |
|---|---|---|---|---|
|
Profit/loss on the portfolio before foreign exchange gain/loss |
||||
|
Income/expense from: |
||||
|
- Equities |
4 |
552 618 |
1 512 742 |
2 454 653 |
|
- Bonds |
4 |
143 415 |
-33 367 |
70 889 |
|
- Unlisted real estate |
6 |
8 662 |
-3 617 |
-3 789 |
|
- Unlisted infrastructure |
7 |
1 426 |
-3 080 |
-627 |
|
- Financial derivatives |
4 |
2 420 |
12 944 |
11 262 |
|
- Secured lending |
10 232 |
9 960 |
21 622 |
|
|
- Secured borrowing |
-12 264 |
-10 609 |
-24 810 |
|
|
Tax expense |
-7 237 |
-10 077 |
-17 211 |
|
|
Interest income/expense |
-749 |
-325 |
-939 |
|
|
Other income/expense |
-53 |
6 |
4 |
|
|
Profit/loss on the portfolio before foreign exchange gain/loss |
698 467 |
1 474 576 |
2 511 054 |
|
|
Foreign exchange gain/loss |
10 |
-1 010 301 |
314 393 |
1 072 207 |
|
Profit/loss on the portfolio |
-311 833 |
1 788 969 |
3 583 261 |
|
|
Management fee |
11 |
-3 999 |
-4 267 |
-7 390 |
|
Profit/loss and total comprehensive income |
-315 832 |
1 784 703 |
3 575 870 |
Balance sheet
|
Amounts in NOK million |
Note |
30.06.2025 |
31.12.2024 |
|---|---|---|---|
|
Assets |
|||
|
Deposits in banks |
22 102 |
25 550 |
|
|
Secured lending |
545 735 |
1 020 455 |
|
|
Cash collateral posted |
15 153 |
11 340 |
|
|
Unsettled trades |
118 000 |
72 619 |
|
|
Equities |
5 |
13 196 848 |
13 290 055 |
|
Equities lent |
5 |
694 692 |
862 197 |
|
Bonds |
5 |
4 974 409 |
4 481 076 |
|
Bonds lent |
5 |
600 156 |
1 088 846 |
|
Financial derivatives |
5 |
24 836 |
32 904 |
|
Unlisted real estate |
6 |
361 348 |
355 769 |
|
Unlisted infrastructure |
7 |
47 356 |
25 236 |
|
Withholding tax receivable |
14 221 |
17 938 |
|
|
Other assets |
4 075 |
1 690 |
|
|
Total assets |
20 618 930 |
21 285 673 |
|
|
Liabilities and owner's capital |
|||
|
Secured borrowing |
773 258 |
1 319 892 |
|
|
Cash collateral received |
48 418 |
103 193 |
|
|
Unsettled trades |
169 602 |
76 260 |
|
|
Financial derivatives |
5 |
25 687 |
31 229 |
|
Deferred tax |
12 081 |
13 170 |
|
|
Other liabilities |
126 |
147 |
|
|
Management fee payable |
3 999 |
190 |
|
|
Total liabilities |
1 033 172 |
1 544 083 |
|
|
Owner's capital |
19 585 757 |
19 741 590 |
|
|
Total liabilities and owner's capital |
20 618 930 |
21 285 673 |
Statement of cash flows
|
Amounts in NOK million, receipt (+) / payment (-) |
Note |
1H 2025 |
1H 2024 |
2024 |
|---|---|---|---|---|
|
Operating activities |
||||
|
Receipts of dividend from equities |
162 206 |
152 668 |
267 025 |
|
|
Receipts of interest from bonds |
78 610 |
59 825 |
131 621 |
|
|
Receipts of interest and dividend from unlisted real estate |
6 |
4 254 |
3 969 |
8 175 |
|
Receipts of interest and dividend from unlisted infrastructure |
7 |
439 |
232 |
440 |
|
Net receipts of interest and fee from secured lending and borrowing |
-2 144 |
-1 805 |
-3 359 |
|
|
Receipts of dividend, interest and fee from holdings of equities, bonds, unlisted real estate and unlisted infrastructure |
243 365 |
214 889 |
403 902 |
|
|
Net cash flow from purchase and sale of equities |
-1 095 |
-163 398 |
-230 218 |
|
|
Net cash flow from purchase and sale of bonds |
-283 972 |
-264 478 |
-650 861 |
|
|
Net cash flow to/from investments in unlisted real estate |
6 |
-21 246 |
-3 327 |
-40 244 |
|
Net cash flow to/from investments in unlisted infrastructure |
7 |
-20 472 |
-5 102 |
-7 614 |
|
Net cash flow financial derivatives |
-1 193 |
9 497 |
20 874 |
|
|
Net cash flow cash collateral related to derivative transactions |
-53 230 |
23 400 |
73 732 |
|
|
Net cash flow secured lending and borrowing |
-14 970 |
21 844 |
65 565 |
|
|
Net payment of taxes |
-3 495 |
-13 123 |
-20 710 |
|
|
Net cash flow related to interest on deposits in banks and bank overdraft |
-80 |
114 |
214 |
|
|
Net cash flow related to other income/expense, other assets and other liabilities |
-1 565 |
9 |
920 |
|
|
Management fee paid to Norges Bank1 |
-190 |
-4 232 |
-7 032 |
|
|
Net cash inflow/outflow from operating activities |
-158 145 |
-183 908 |
-391 472 |
|
|
Financing activities |
||||
|
Inflow from the Norwegian government |
158 315 |
193 009 |
411 365 |
|
|
Withdrawal by the Norwegian government |
- |
- |
- |
|
|
Net cash inflow/outflow from financing activities |
158 315 |
193 009 |
411 365 |
|
|
Net change deposits in banks |
||||
|
Deposits in banks at 1 January |
25 550 |
8 584 |
8 584 |
|
|
Net increase/decrease of cash in the period |
170 |
9 101 |
19 892 |
|
|
Net foreign exchange gain/loss on cash |
-3 617 |
-232 |
-2 927 |
|
|
Deposits in banks at end of period |
22 102 |
17 454 |
25 550 |
1 Management fee in the statement of cash flows consists of transfers to/from the krone account in connection with the settlement of management costs incurred in Norges Bank.
Statement of changes in owner's capital
|
Amounts in NOK million |
Inflows from owner |
Retained earnings |
Total owner's capital |
|---|---|---|---|
|
1 January 2024 |
4 768 370 |
10 988 349 |
15 756 719 |
|
Profit/loss and total comprehensive income |
- |
1 784 703 |
1 784 703 |
|
Inflow during the period |
192 000 |
- |
192 000 |
|
Withdrawal during the period |
- |
- |
- |
|
30 June 2024 |
4 960 370 |
12 773 052 |
17 733 422 |
|
1 July 2024 |
4 960 370 |
12 773 052 |
17 733 422 |
|
Profit/loss and total comprehensive income |
- |
1 791 167 |
1 791 167 |
|
Inflow during the period |
217 000 |
- |
217 000 |
|
Withdrawal during the period |
- |
- |
- |
|
31 December 2024 |
5 177 370 |
14 564 220 |
19 741 590 |
|
1 January 2025 |
5 177 370 |
14 564 220 |
19 741 590 |
|
Profit/loss and total comprehensive income |
- |
-315 832 |
-315 832 |
|
Inflow during the period |
160 000 |
- |
160 000 |
|
Withdrawal during the period |
- |
- |
- |
|
30 June 2025 |
5 337 370 |
14 248 388 |
19 585 757 |
Notes
Note 1 General information
Introduction
Norges Bank is Norway’s central bank. Norges bank is a separate legal entity and is owned by the state. Norges bank manages the Government Pension Fund Global (GPFG) on behalf of the Ministry of Finance, in accordance with section 3, second paragraph of the Government Pension Fund Act and the management mandate for the GPFG, issued by the Ministry of Finance.
The GPFG shall support government saving to finance future expenditure and underpin long-term considerations relating to the use of Norway’s petroleum revenues. The Storting (Norwegian Parliament) has established the legal framework in the Government Pension Fund Act, and the Ministry of Finance has formal responsibility for the fund’s management. The Executive Board of Norges Bank has delegated day-to-day management of the GPFG to Norges Bank Investment Management (NBIM).
The Ministry of Finance has placed funds for investment in the GPFG in the form of a Norwegian krone deposit with Norges Bank (the krone account). Norges Bank manages the krone account in its own name by investing the funds in an investment portfolio consisting of listed equities, bonds, real estate and renewable energy infrastructure. The GPFG is invested in its entirety outside of Norway.
Transfers are made to and from the krone account in accordance with the management mandate. When the Norwegian State’s petroleum revenue exceeds the use of petroleum revenue in the fiscal budget, deposits will be made into the krone account. In the opposite situation, withdrawals will be made. Transfers to and from the krone account lead to a corresponding change in owner’s capital.
Approval of the interim financial statements
The interim financial statements of Norges Bank for the first half of 2025, which only encompass the financial reporting for the GPFG, were approved by the Executive Board on 8 August 2025.
Note 2 Accounting policies
Basis of preparation
In accordance with the Regulation on the financial reporting of Norges Bank (the Regulation), laid down by the Ministry of Finance, the financial reporting for the GPFG is prepared in accordance with IFRS Accounting Standards as adopted by the EU, based on the going concern assumption.
The condensed interim financial statements for the first half of 2025 are prepared in accordance with IAS 34 Interim Financial Reporting. The interim financial statements are presented in Norwegian kroner (NOK), rounded to the nearest million. Rounding differences may occur.
The interim financial statements are prepared using the same accounting policies and calculation methods as applied and disclosed in the annual report for 2024. The condensed interim financial statements do not include all the information and disclosures required in annual financial statements and should therefore be read in conjunction with the annual report for 2024.
Significant estimates and accounting judgements
The preparation of the interim financial statements involves the use of uncertain estimates and assumptions relating to future events that affect the reported amounts for assets, liabilities, income and expenses. Estimates are based on historical experience and reflect management’s expectations about future events. Actual outcomes may deviate from estimates. The preparation of the interim financial statements also involves the use of judgement when applying accounting policies, which may have a significant impact on the financial statements.
In cases where there are particularly uncertain estimates or accounting judgements, this is described in the respective notes.
Note 3 Returns
Table 3.1 Returns
|
1H 2025 |
1H 2024 |
2024 |
|
|---|---|---|---|
|
Returns measured in the fund's currency basket (percent) |
|||
|
Return on equity investments |
6.73 |
12.47 |
18.19 |
|
Return on fixed-income investments |
3.31 |
-0.62 |
1.28 |
|
Return on unlisted real estate investments |
4.02 |
-0.50 |
-0.57 |
|
Return on unlisted infrastructure investments |
9.43 |
-17.69 |
-9.81 |
|
Return on fund |
5.74 |
8.59 |
13.09 |
|
Relative return on fund (percentage points) |
-0.05 |
-0.04 |
-0.45 |
|
Returns measured in Norwegian kroner (percent) |
|||
|
Return on equity investments |
-0.67 |
15.32 |
28.10 |
|
Return on fixed-income investments |
-3.85 |
1.90 |
9.77 |
|
Return on unlisted real estate investments |
-3.19 |
2.02 |
7.77 |
|
Return on unlisted infrastructure investments |
1.84 |
-15.61 |
-2.25 |
|
Return on fund |
-1.59 |
11.34 |
22.57 |
For additional information on the calculation methods used when measuring returns, see note 3 Returns in the annual report for 2024.
Note 4 Income/expense from equities, bonds and financial derivatives
Tables 4.1 to 4.3 specify the change in fair value in the period, where the line Income/expense shows the amount recognised in profit or loss for the respective income statement line.
Table 4.1 Specification Income/expense from equities
|
Amounts in NOK million |
1H 2025 |
1H 2024 |
2024 |
|---|---|---|---|
|
Dividends |
167 471 |
158 335 |
270 263 |
|
Realised gain/loss |
360 266 |
325 684 |
617 366 |
|
Unrealised gain/loss |
24 882 |
1 028 723 |
1 567 024 |
|
Income/expense from equities before foreign exchange gain/loss |
552 618 |
1 512 742 |
2 454 653 |
Table 4.2 Specification Income/expense from bonds
|
Amounts in NOK million |
1H 2025 |
1H 2024 |
2024 |
|---|---|---|---|
|
Interest |
85 375 |
71 375 |
157 191 |
|
Realised gain/loss |
-20 773 |
-41 233 |
-44 964 |
|
Unrealised gain/loss |
78 813 |
-63 509 |
-41 338 |
|
Income/expense from bonds before foreign exchange gain/loss |
143 415 |
-33 367 |
70 889 |
Table 4.3 Specification Income/expense from financial derivatives
|
Amounts in NOK million |
1H 2025 |
1H 2024 |
2024 |
|---|---|---|---|
|
Interest |
488 |
-1 602 |
-4 494 |
|
Realised gain/loss |
4 278 |
12 945 |
11 411 |
|
Unrealised gain/loss |
-2 347 |
1 602 |
4 345 |
|
Income/expense from financial derivatives before foreign exchange gain/loss |
2 420 |
12 944 |
11 262 |
Note 5 Holdings of equities, bonds and financial derivatives
Table 5.1 specifies the sector composition of investments in equities.
Table 5.1 Equities
|
Amounts in NOK million |
30.06.2025 Fair value |
31.12.2024 Fair value |
|---|---|---|
|
Technology |
3 657 364 |
3 821 747 |
|
Financials |
2 350 878 |
2 175 781 |
|
Consumer discretionary |
1 904 913 |
2 018 538 |
|
Industrials |
1 852 007 |
1 790 346 |
|
Health care |
1 261 217 |
1 390 234 |
|
Consumer staples |
617 957 |
652 771 |
|
Real estate |
658 945 |
691 317 |
|
Basic materials |
432 392 |
434 985 |
|
Energy |
401 931 |
444 666 |
|
Telecommunications |
408 571 |
405 090 |
|
Utilities |
345 365 |
326 775 |
|
Total equities |
13 891 540 |
14 152 251 |
|
Of which presented in the balance sheet line Equities |
13 196 848 |
13 290 055 |
|
Of which presented in the balance sheet line Equities lent |
694 692 |
862 197 |
At the end of the first half of 2025, earned dividends amounted to NOK 15 527 million (NOK 12 234 million at the end of 2024).
Table 5.2 specifies investments in bonds per category. Notional value represents the amount that shall be returned at maturity, also referred to as the par value of the bond.
Table 5.2 Bonds
|
30.06.2025 |
31.12.2024 |
|||
|---|---|---|---|---|
|
Amounts in NOK million |
Notional value |
Fair value incl. earned interest |
Notional value |
Fair value incl. earned interest |
|
Government bonds |
3 264 077 |
3 078 008 |
3 388 045 |
3 166 117 |
|
Government-related bonds |
533 613 |
522 157 |
507 114 |
492 665 |
|
Inflation-linked bonds |
353 924 |
333 999 |
325 074 |
303 792 |
|
Corporate bonds |
1 362 284 |
1 320 416 |
1 367 998 |
1 302 352 |
|
Securitised bonds |
333 424 |
319 985 |
322 255 |
304 996 |
|
Total bonds |
5 847 322 |
5 574 565 |
5 910 486 |
5 569 922 |
|
Of which presented in the balance sheet line Bonds |
4 974 409 |
4 481 076 |
||
|
Of which presented in the balance sheet line Bonds lent |
600 156 |
1 088 846 |
||
At the end of the first half of 2025, earned interest amounted to NOK 51 239 million (NOK 51 128 million at the end of 2024).
Financial derivatives
Financial derivatives are used to adjust the exposure in various portfolios as a cost-efficient alternative to trading in the underlying securities. Foreign exchange derivatives are also used in connection with liquidity management. Equity derivatives with an option component are often a result of corporate actions, and can be converted into equities or sold. The GPFG also uses equity swaps in combination with purchase and sale of equities. Equity swaps are not recognised in the balance sheet. See the accounting policy in note 13 Secured lending and borrowing in the annual report for 2024 for further information.
Table 5.3 specifies financial derivatives recognised in the balance sheet. Notional amounts are the basis for calculating any cash flows and gains/losses for derivative contracts. This provides information on the extent to which different types of financial derivatives are used.
Table 5.3 Financial derivatives
|
30.06.2025 |
31.12.2024 |
|||||
|---|---|---|---|---|---|---|
|
Amounts in NOK million |
Notional amount |
Fair value |
Notional amount |
Fair value |
||
|
Asset |
Liability |
Asset |
Liability |
|||
|
Foreign exchange derivatives |
975 858 |
4 285 |
6 573 |
1 216 103 |
14 652 |
10 267 |
|
Interest rate derivatives |
4 028 082 |
16 619 |
9 782 |
2 827 002 |
14 028 |
10 961 |
|
Credit derivatives |
146 228 |
3 743 |
9 303 |
173 841 |
4 147 |
9 982 |
|
Equity derivatives1 |
- |
161 |
- |
- |
36 |
- |
|
Exchange-traded futures contracts2 |
203 699 |
29 |
30 |
174 242 |
40 |
20 |
|
Total financial derivatives |
5 353 867 |
24 836 |
25 687 |
4 391 189 |
32 904 |
31 229 |
1 Notional amounts are not considered relevant for equity derivatives and are therefore not included in the table.
2 Exchange-traded futures contracts have daily margin payments and the net amount recognised in the balance sheet is normally zero at the balance sheet date, with the exception of futures contracts in certain markets where there is different timing for setting the market value for recognition in the balance sheet and daily margining.
Note 6 Unlisted real estate
Investments in unlisted real estate are made through subsidiaries of Norges Bank, exclusively established as part of the management of the GPFG. Subsidiaries presented as Unlisted real estate in the balance sheet are measured at fair value through profit or loss. The fair value of unlisted real estate is equivalent to the sum of the GPFG’s share of assets and liabilities in the underlying real estate subsidiaries, measured at fair value. For further information, see note 2 Accounting policies and note 8 Fair value measurement in the annual report for 2024.
Income/expense, changes in carrying amounts and cash flows related to investments in unlisted real estate are specified in the tables below. See note 6 Unlisted real estate in the annual report for 2024 for further information on the principles applied in the tables.
Table 6.1 Income/expense from unlisted real estate
|
Amounts in NOK million |
1H 2025 |
1H 2024 |
2024 |
|---|---|---|---|
|
Receipts of interest and dividend |
4 254 |
3 969 |
8 175 |
|
Unrealised gain/loss1 |
4 408 |
-7 586 |
-11 963 |
|
Income/expense from unlisted real estate before foreign exchange gain/loss |
8 662 |
-3 617 |
-3 789 |
1 Earned interest and dividends which are not cash-settled are included in Unrealised gain/loss.
Table 6.2 Changes in carrying amounts unlisted real estate
|
Amounts in NOK million |
30.06.2025 |
31.12.2024 |
|---|---|---|
|
Unlisted real estate at 1 January |
355 769 |
300 541 |
|
Net cash flow to/from investments |
21 246 |
40 244 |
|
Unrealised gain/loss |
4 408 |
-11 963 |
|
Foreign exchange gain/loss |
-20 075 |
26 947 |
|
Unlisted real estate, closing balance for the period |
361 348 |
355 769 |
Table 6.3 specifies cash flows between the GPFG and subsidiaries presented as Unlisted real estate.
Table 6.3 Cash flow unlisted real estate
|
Amounts in NOK million |
1H 2025 |
1H 2024 |
2024 |
|---|---|---|---|
|
Receipts of interest from ongoing operations |
1 243 |
1 387 |
2 889 |
|
Receipts of dividends from ongoing operations |
3 010 |
2 548 |
5 252 |
|
Receipts of interest from sales |
- |
33 |
33 |
|
Receipts of interest and dividend from unlisted real estate |
4 254 |
3 969 |
8 175 |
|
Payments for new investments |
-17 902 |
-2 208 |
-37 716 |
|
Payments for property development |
-2 288 |
-1 502 |
-3 444 |
|
Net payments external debt |
-1 742 |
- |
- |
|
Receipts from ongoing operations |
686 |
357 |
890 |
|
Receipts from sales |
- |
26 |
26 |
|
Net cash flow to/from investments in unlisted real estate |
-21 246 |
-3 327 |
-40 244 |
|
Net cash flow unlisted real estate |
-16 993 |
642 |
-32 069 |
|
Of which cash flow from ongoing operations |
4 940 |
4 293 |
9 032 |
|
Of which cash flow to/from other activities |
-21 933 |
-3 651 |
-41 101 |
Underlying real estate companies
Real estate subsidiaries have investments in other non-consolidated, unlisted companies. For further information, see note 16 Interests in other entities in the annual report for 2024.
Table 6.4 specifies the GPFG’s share of net income generated in the underlying real estate companies, which is the basis for Income/expense from unlisted real estate presented in table 6.1.
Table 6.4 Income from underlying real estate companies
|
Amounts in NOK million |
1H 2025 |
1H 2024 |
2024 |
|---|---|---|---|
|
Net rental income |
8 525 |
7 122 |
14 708 |
|
External asset management – fixed fees |
-589 |
-499 |
-1 023 |
|
External asset management – variable fees |
-1 |
-1 |
-24 |
|
Internal asset management – fixed fees1 |
-59 |
-56 |
-114 |
|
Operating costs in wholly-owned subsidiaries2 |
-59 |
-33 |
-76 |
|
Operating costs in joint ventures |
-89 |
-88 |
-174 |
|
Interest income/expense |
-468 |
-353 |
-806 |
|
Tax expense |
-154 |
-148 |
-253 |
|
Net income from ongoing operations |
7 106 |
5 945 |
12 237 |
|
Realised gain/loss |
35 |
92 |
93 |
|
Unrealised gain/loss3 |
1 911 |
-9 657 |
-15 718 |
|
Realised and unrealised gain/loss |
1 946 |
-9 564 |
-15 625 |
|
Transaction costs and fees from purchases and sales |
-391 |
3 |
-400 |
|
Net income underlying real estate companies |
8 662 |
-3 617 |
-3 789 |
1 Internal asset management is carried out on 100 percent owned properties by employees in a wholly-owned, consolidated subsidiary.
2 Operating costs in wholly-owned subsidiaries are measured against the upper limit from the Ministry of Finance, see note 11 for more information.
3 Unrealised gain/loss presented in table 6.1 includes net income in the underlying real estate companies which is not distributed back to the GPFG, and will therefore not correspond to Unrealised gain/loss presented in table 6.4.
Table 6.5 specifies the GPFG’s share of assets and liabilities in the underlying real estate companies, which comprises the closing balance for Unlisted real estate presented in table 6.2.
Table 6.5 Assets and liabilities underlying real estate companies
|
Amounts in NOK million |
30.06.2025 |
31.12.2024 |
|---|---|---|
|
Properties |
394 925 |
374 603 |
|
External debt |
-33 798 |
-31 494 |
|
Net other assets and liabilities1 |
222 |
12 660 |
|
Total assets and liabilities underlying real estate companies |
361 348 |
355 769 |
1 Net other assets and liabilities comprise cash, tax and operational receivables and liabilities.
Note 7 Unlisted renewable energy infrastructure
Investments in unlisted renewable energy infrastructure (Unlisted infrastructure) are made through subsidiaries of Norges Bank, exclusively established as part of the management of the GPFG. Subsidiaries presented as Unlisted infrastructure in the balance sheet are measured at fair value through profit or loss. The fair value of unlisted infrastructure is equivalent to the sum of the GPFG’s share of assets and liabilities in the underlying infrastructure subsidiaries, measured at fair value. For further information, see note 2 Accounting policies and note 8 Fair value measurement in the annual report for 2024.
Income/expense, changes in carrying amounts and cash flows related to investments in unlisted infrastructure are specified in the tables below. See note 7 Unlisted renewable energy infrastructure in the annual report for 2024 for further information on the principles applied in the tables.
Table 7.1 Income/expense from unlisted infrastructure
|
Amounts in NOK million |
1H 2025 |
1H 2024 |
2024 |
|---|---|---|---|
|
Receipts of interest and dividend |
439 |
232 |
440 |
|
Unrealised gain/loss1 |
986 |
-3 312 |
-1 067 |
|
Income/expense from unlisted infrastructure before foreign exchange gain/loss |
1 426 |
-3 080 |
-627 |
1 Earned interest and dividends which are not cash-settled are included in Unrealised gain/loss.
Table 7.2 Changes in carrying amounts unlisted infrastructure
|
Amounts in NOK million |
30.06.2025 |
31.12.2024 |
|---|---|---|
|
Unlisted infrastructure at 1 January |
25 236 |
17 593 |
|
Net cash flow to/from investments |
20 472 |
7 614 |
|
Unrealised gain/loss |
986 |
-1 067 |
|
Foreign exchange gain/loss |
661 |
1 096 |
|
Unlisted infrastructure, closing balance for the period |
47 356 |
25 236 |
Table 7.3 specifies cash flows between the GPFG and subsidiaries presented as Unlisted infrastructure.
Table 7.3 Cash flow unlisted infrastructure
|
Amounts in NOK million |
1H 2025 |
1H 2024 |
2024 |
|---|---|---|---|
|
Receipts of interest from ongoing operations |
247 |
199 |
407 |
|
Receipts of dividends from ongoing operations |
192 |
33 |
33 |
|
Receipts of interest and dividend from unlisted infrastructure |
439 |
232 |
440 |
|
Payments for new investments |
-20 387 |
-4 941 |
-7 541 |
|
Payments for development of infrastructure assets |
-260 |
-436 |
-681 |
|
Receipts from ongoing operations |
174 |
275 |
608 |
|
Net cash flow to/from investments in unlisted infrastructure |
-20 472 |
-5 102 |
-7 614 |
|
Net cash flow unlisted infrastructure |
-20 033 |
-4 870 |
-7 174 |
|
Of which cash flow from ongoing operations |
613 |
507 |
1 048 |
|
Of which cash flow to/from other activities |
-20 647 |
-5 378 |
-8 222 |
Underlying infrastructure companies
Infrastructure subsidiaries have investments in other non-consolidated, unlisted companies. For further information, see note 16 Interests in other entities in the annual report for 2024.
Table 7.4 specifies the GPFG’s share of net income generated in the underlying infrastructure companies, which is the basis for Income/expense from unlisted infrastructure presented in table 7.1.
Table 7.4 Income from underlying infrastructure companies
|
Amounts in NOK million |
1H 2025 |
1H 2024 |
2024 |
|---|---|---|---|
|
Net income from sale of renewable energy |
881 |
445 |
1 661 |
|
Fees to external fund manager |
-11 |
- |
-148 |
|
Operating costs in wholly-owned subsidiaries1 |
-9 |
-5 |
-12 |
|
Operating costs in joint ventures |
-73 |
2 |
-226 |
|
Interest income/expense |
-66 |
-5 |
-222 |
|
Tax expense |
-132 |
-9 |
-84 |
|
Net income from ongoing operations |
590 |
429 |
970 |
|
Unrealised gain/loss2 |
844 |
-3 449 |
-1 503 |
|
Transaction costs and fees from purchases |
-8 |
-60 |
-95 |
|
Net income underlying infrastructure companies |
1 426 |
-3 080 |
-627 |
1 Operating costs in wholly-owned subsidiaries are measured against the upper limit from the Ministry of Finance, see note 11 for more information.
2 Unrealised gain/loss presented in table 7.1 includes net income in the underlying infrastructure companies which is not distributed back to the GPFG, and will therefore not correspond to Unrealised gain/loss presented in table 7.4.
Table 7.5 specifies the GPFG’s share of assets and liabilities in the underlying infrastructure companies, which comprises the closing balance for Unlisted infrastructure as presented in table 7.2.
Table 7.5 Assets and liabilities underlying infrastructure companies
|
Amounts in NOK million |
30.06.2025 |
31.12.2024 |
|---|---|---|
|
Infrastructure assets |
48 792 |
32 582 |
|
External debt |
-8 434 |
-9 109 |
|
Net other assets and liabilities1 |
6 998 |
1 763 |
|
Total assets and liabilities underlying infrastructure companies |
47 356 |
25 236 |
1 Net other assets and liabilities comprise cash, tax and operational receivables and liabilities.
Note 8 Fair value measurement
Fair value for the majority of assets and liabilities is based on quoted market prices or observable market inputs. If the market is not active, fair value is established using valuation techniques that maximise the use of relevant observable inputs. Estimating fair value can be complex and require the use of judgement, particularly when observable inputs are not available. For an overview of valuation models and techniques, as well as definitions and the classification in the three categories in the fair value hierarchy, see note 8 Fair value measurement in the annual report for 2024.
Significant estimates
Classification in the fair value hierarchy is based on set criteria, some of which may require the use of judgement.
Level 3 investments consist of instruments measured at fair value that are not traded or quoted in active markets. Fair value is determined using valuation techniques that use models with significant use of unobservable inputs. A considerable degree of judgement is applied in determining the assumptions that market participants would use when pricing the asset or liability, when observable market data is not available.
The fair value hierarchy
Table 8.1 Categorisation of the investment portfolio by level in the fair value hierarchy
|
Level 1 |
Level 2 |
Level 3 |
Total |
|||||
|---|---|---|---|---|---|---|---|---|
|
Amounts in NOK million |
30.06.2025 |
31.12.2024 |
30.06.2025 |
31.12.2024 |
30.06.2025 |
31.12.2024 |
30.06.2025 |
31.12.2024 |
|
Equities |
13 857 030 |
14 117 497 |
32 778 |
33 124 |
1 732 |
1 630 |
13 891 540 |
14 152 251 |
|
Government bonds |
2 660 826 |
2 862 994 |
417 182 |
303 122 |
- |
- |
3 078 008 |
3 166 117 |
|
Government-related bonds |
467 909 |
415 878 |
53 316 |
75 397 |
931 |
1 389 |
522 157 |
492 665 |
|
Inflation-linked bonds |
293 427 |
245 771 |
40 572 |
58 021 |
- |
- |
333 999 |
303 792 |
|
Corporate bonds |
1 307 838 |
1 277 040 |
12 578 |
25 311 |
1 |
1 |
1 320 416 |
1 302 352 |
|
Securitised bonds |
287 806 |
257 841 |
32 179 |
47 157 |
- |
- |
319 985 |
304 996 |
|
Total bonds |
5 017 806 |
5 059 523 |
555 827 |
509 008 |
932 |
1 390 |
5 574 565 |
5 569 922 |
|
Financial derivatives (assets) |
3 793 |
4 051 |
21 033 |
28 843 |
9 |
10 |
24 836 |
32 904 |
|
Financial derivatives (liabilities) |
-9 303 |
-9 434 |
-16 384 |
-21 795 |
- |
- |
-25 687 |
-31 229 |
|
Total financial derivatives |
-5 510 |
-5 383 |
4 649 |
7 048 |
9 |
10 |
-851 |
1 675 |
|
Unlisted real estate |
- |
- |
- |
- |
361 348 |
355 769 |
361 348 |
355 769 |
|
Unlisted infrastructure |
- |
- |
- |
- |
47 356 |
25 236 |
47 356 |
25 236 |
|
Other (assets)1 |
- |
- |
719 285 |
1 149 591 |
- |
- |
719 285 |
1 149 591 |
|
Other (liabilities)2 |
- |
- |
-991 405 |
-1 499 493 |
- |
- |
-991 405 |
-1 499 493 |
|
Market value investment portfolio3 |
18 869 326 |
19 171 638 |
321 134 |
199 278 |
411 377 |
384 035 |
19 601 838 |
19 754 950 |
|
Total (percent) |
96.3 |
97.1 |
1.6 |
1.0 |
2.1 |
1.9 |
100.0 |
100.0 |
1 Other (assets) consists of the balance sheet lines Deposits in banks, Secured lending, Cash collateral posted, Unsettled trades (assets), Withholding tax receivable and Other assets.
2 Other (liabilities) consists of the balance sheet lines Secured borrowing, Cash collateral received, Unsettled trades (liabilities) and Other liabilities.
3 Market value investment portfolio is exclusive of Management fee payable/receivable and Deferred tax.
The majority of the total portfolio is priced based on observable market prices. At the end of the first half of 2025, 97.9 percent of the portfolio was classified as Level 1 or 2, which is a marginal decrease compared to year-end 2024.
Equities
Measured as a share of total value, virtually all equities (99.75 percent) were valued based on official closing prices from stock exchanges and were classified as Level 1 at the end of the first half. A small share of equities (0.24 percent) were classified as Level 2. These are mainly equities that are valued based on derived prices. The share of equities valued with significant use of unobservable inputs and classified as Level 3 was 0.01 percent. These are equities that are not listed, or where trading has been suspended and an adjustment has been applied to the last traded price based on company- or country-specific factors.
Bonds
The majority of bonds have observable, executable market quotes in active markets and 90.01 percent of bond holdings were classified as Level 1 at the end of the first half. Bond holdings that do not have a sufficient number of observable quotes or that are priced based on comparable liquid bonds are classified as Level 2. These amounted to 9.97 percent of bond holdings at the end of the first half. An insignificant share of bond holdings (0.02 percent) that did not have observable quotes were classified as Level 3, since the valuation was based on significant use of unobservable inputs.
Unlisted real estate and unlisted renewable energy infrastructure
All investments in unlisted real estate and unlisted renewable energy infrastructure are classified as Level 3, since models are used to value the underlying assets and liabilities, with extensive use of unobservable market inputs. Properties and direct investments in unlisted infrastructure are measured at the value determined by external valuers. Exceptions to this policy are newly acquired investments where the purchase price, excluding transaction costs, is normally considered to be the best estimate of fair value, or where there are indications that the value determined by external valuers does not reflect fair value and adjustments are therefore warranted.
The fund had one investment in an unlisted infrastructure fund at the end of the first half. This was measured at the fair value provided by the fund manager.
Financial derivatives
Some equity derivatives (rights and warrants) and credit derivatives (CDS indices) that are actively traded, are classified as Level 1. The majority of derivatives are classified as Level 2, since the valuation of these is based on standard models using observable market inputs. Certain derivatives are valued based on models with significant use of unobservable inputs and are classified as Level 3.
Other assets and liabilities that are part of the investment portfolio are classified as Level 2.
Movements between the levels in the fair value hierarchy
There were no significant reclassifications of equity holdings between the levels in the fair value hierarchy during the first half.
Bond holdings with a net value of NOK 7 billion were reclassified from Level 1 to Level 2 in the first half. Bonds with a value of NOK 115 billion were reclassified from Level 1 to Level 2, primarily due to reduced liquidity for certain holdings of government bonds. This was partly offset by bonds with a value of NOK 108 billion which were reclassified from Level 2 to Level 1. There were no significant reclassifications of bonds holdings into or out of Level 3 in the first half.
Table 8.2 Changes in Level 3 holdings
|
Amounts in NOK million |
01.01.2025 |
Purchases |
Sales |
Settlements |
Net gain/loss |
Transferred into Level 3 |
Transferred out of Level 3 |
Foreign exchange gain/loss |
30.06.2025 |
|---|---|---|---|---|---|---|---|---|---|
|
Equities |
1 630 |
23 |
-43 |
- |
-164 |
136 |
-3 |
153 |
1 732 |
|
Bonds |
1 390 |
- |
- |
-29 |
16 |
- |
-333 |
-113 |
932 |
|
Financial derivatives (assets) |
10 |
- |
- |
- |
- |
- |
- |
-1 |
9 |
|
Unlisted real estate1 |
355 769 |
21 246 |
- |
- |
4 408 |
- |
- |
-20 075 |
361 348 |
|
Unlisted infrastructure1 |
25 236 |
20 472 |
- |
- |
986 |
- |
- |
661 |
47 356 |
|
Total |
384 035 |
41 741 |
-43 |
-29 |
5 247 |
136 |
-336 |
-19 374 |
411 377 |
|
Amounts in NOK million |
01.01.2024 |
Purchases |
Sales |
Settlements |
Net gain/loss |
Transferred into Level 3 |
Transferred out of Level 3 |
Foreign exchange gain/loss |
31.12.2024 |
|---|---|---|---|---|---|---|---|---|---|
|
Equities |
1 500 |
23 |
-33 |
21 |
-72 |
277 |
-65 |
-21 |
1 630 |
|
Bonds |
916 |
- |
-105 |
-56 |
-46 |
535 |
-9 |
155 |
1 390 |
|
Financial derivatives (assets) |
4 |
6 |
- |
- |
1 |
- |
-1 |
- |
10 |
|
Unlisted real estate1 |
300 541 |
40 244 |
- |
- |
-11 963 |
- |
- |
26 947 |
355 769 |
|
Unlisted infrastructure1 |
17 593 |
7 614 |
- |
- |
-1 067 |
- |
- |
1 096 |
25 236 |
|
Total |
320 554 |
47 887 |
-138 |
-35 |
-13 147 |
812 |
-75 |
28 177 |
384 035 |
1 Purchases represent the net cash flow to investments in unlisted real estate and unlisted infrastructure, as presented in the Statement of cash flows.
The share of the portfolio classified as Level 3 was 2.1 percent at the end of the first half, which is a slight increase compared to year-end 2024. The GPFG’s aggregate holdings in Level 3 were NOK 411 377 million at the end of the first half, an increase of NOK 27 342 million compared to year-end 2024. The increase is mainly due to investments in unlisted real estate and unlisted renewable energy infrastructure, which are all classified as Level 3.
Russian equities constituted the majority of equity securities classified as Level 3 at the end of the first half. These securities had a value of NOK 1.4 billion at the end of the first half, compared to NOK 1.2 billion at year-end 2024.
Sensitivity analysis for Level 3 holdings
The valuation of Level 3 holdings involves the use of judgement when determining the assumptions that market participants would use when observable market data is not available.
Unlisted real estate investments constitute the vast majority of holdings classified as Level 3. The effect of using reasonable alternative assumptions for unlisted real estate investments is shown in the sensitivity analysis in table 8.3. For other holdings classified as Level 3, there are no significant changes to sensitivities compared to year-end 2024.
Table 8.3 Additional specification Level 3 and sensitivities – unlisted real estate
|
Amounts in NOK million |
Key assumptions |
Change in key assumptions |
Specification of Level 3 holdings 30.06.2025 |
Sensitivities 30.06.2025 |
Change in key assumptions |
Specification of Level 3 holdings 31.12.2024 |
Sensitivities |
||
|---|---|---|---|---|---|---|---|---|---|
|
Unfavourable changes |
Favourable changes |
Unfavourable changes |
Favourable changes |
||||||
|
Unlisted real estate |
Yield |
0.25 percentage point |
-16 949 |
19 181 |
0.25 percentage point |
-16 687 |
18 885 |
||
|
Market rent |
2.0 percent |
-5 745 |
5 751 |
2.0 percent |
-5 657 |
5 662 |
|||
|
361 348 |
-22 694 |
24 932 |
355 769 |
-22 344 |
24 547 |
||||
Changes in key assumptions can have a material effect on the valuation of unlisted real estate investments. Several key assumptions are used, of which yields and growth forecasts for future market rents are the assumptions that have the largest impact when estimating property values. This is illustrated in the sensitivity analysis by using other reasonable assumptions for yields and market rents. The sensitivity analysis is based on a statistically relevant sample that is representative for the unlisted real estate portfolio and reflects both favourable and unfavourable changes. At the end of the first half, a change in the yield of 0.25 percentage point, and a change in market rents of 2 percent is viewed as a reasonable range for alternative assumptions.
In an unfavourable outcome, an increase in the yield of 0.25 percentage point, and a reduction in market rents of 2 percent would result in a decrease in value of the unlisted real estate portfolio of approximately NOK 22 694 million or 6.3 percent (6.3 percent at year-end 2024). In a favourable outcome, a reduction in the yield of 0.25 percentage point and an increase in market rents of 2 percent would result in an increase in value of the unlisted real estate portfolio of approximately NOK 24 932 million or 6.9 percent (6.9 percent at year-end 2024). The isolated effects of changes in yields and future market rents are presented in table 8.3.
Changes outside of the ranges specified above are considered to be less reasonable alternative assumptions, however if the range of alternative assumptions were to be expanded, the value changes would be approximately linear.
Note 9 Investment risk
Investment risk comprises market risk, credit risk and counterparty risk. For further information on the framework for investment risk, including the main dimensions and measurement methods used to manage investment risk, see note 9 Investment risk in the annual report for 2024.
Market risk
Market risk is the risk of loss or a change in the market value of the portfolio, or parts of the portfolio, due to changes in financial market variables, real estate and infrastructure values. Norges Bank Investment Management measures market risk both in absolute terms and relative to the benchmark.
Asset class by country and currency
The portfolio is invested across several asset classes, countries and currencies as shown in table 9.1.
Table 9.1 Allocation by asset class, country and currency
|
Market value in percent by country and currency1 |
Market value by asset class in percent |
Market value by asset class in NOK million |
|||||||
|---|---|---|---|---|---|---|---|---|---|
|
Asset class |
Market |
30.06.2025 |
Market |
31.12.2024 |
30.06.2025 |
31.12.2024 |
30.06.2025 |
31.12.2024 |
|
|
Equities |
Developed |
89.1 |
Developed |
89.2 |
|||||
|
US |
53.8 |
US |
54.7 |
||||||
|
Japan |
6.5 |
Japan |
6.6 |
||||||
|
UK |
4.9 |
UK |
5.2 |
||||||
|
Germany |
3.6 |
Switzerland |
3.2 |
||||||
|
Switzerland |
3.2 |
Germany |
3.2 |
||||||
|
Total other |
17.1 |
Total other |
16.3 |
||||||
|
Emerging |
10.9 |
Emerging |
10.8 |
||||||
|
China |
3.6 |
China |
3.3 |
||||||
|
Taiwan |
2.4 |
India |
2.5 |
||||||
|
India |
2.4 |
Taiwan |
2.5 |
||||||
|
Brazil |
0.4 |
Brazil |
0.4 |
||||||
|
South Africa |
0.4 |
South Africa |
0.4 |
||||||
|
Total other |
1.6 |
Total other |
1.7 |
||||||
|
Total equities |
70.61 |
71.44 |
13 841 392 |
14 112 924 |
|||||
|
Bonds |
Developed |
99.7 |
Developed |
100.0 |
|||||
|
US dollar |
52.7 |
US dollar |
54.4 |
||||||
|
Euro |
28.6 |
Euro |
27.4 |
||||||
|
Japanese yen |
6.0 |
Japanese yen |
5.9 |
||||||
|
British pound |
4.6 |
British pound |
4.6 |
||||||
|
Canadian dollar |
3.9 |
Canadian dollar |
3.8 |
||||||
|
Total other |
3.7 |
Total other |
4.0 |
||||||
|
Emerging2 |
0.3 |
Emerging2 |
0.0 |
||||||
|
Total bonds |
27.09 |
26.59 |
5 311 014 |
5 253 095 |
|||||
|
Unlisted real estate |
US |
44.7 |
US |
50.0 |
|||||
|
UK |
22.5 |
UK |
20.1 |
||||||
|
France |
16.5 |
France |
14.8 |
||||||
|
Germany |
5.1 |
Germany |
5.0 |
||||||
|
Switzerland |
3.0 |
Switzerland |
3.0 |
||||||
|
Total other |
8.2 |
Total other |
7.2 |
||||||
|
Total unlisted real estate |
1.86 |
1.84 |
365 194 |
363 583 |
|||||
|
Total unlisted infrastructure |
0.43 |
0.13 |
84 238 |
25 348 |
|||||
|
Market value investment portfolio3 |
19 601 838 |
19 754 950 |
|||||||
1 Market value in percent by country and currency includes derivatives and cash.
2 The share of individual emerging market currencies in the fixed income portfolio is insignificant.
3 Market value investment portfolio is exclusive of Management fee payable/receivable and Deferred tax.
At the end of the first half, the equity portfolio’s share of the fund was 70.6 percent, compared to 71.4 percent at year-end 2024. The bond portfolio’s share of the fund was 27.1 percent, compared to 26.6 percent at year-end. The unlisted real estate portfolio’s share of the fund was 1.9 percent, compared to 1.8 percent at year-end. The share of unlisted infrastructure in the fund was 0.4 percent, compared to 0.1 percent at year-end.
Volatility
Risk measures are used to quantify the risk of value changes associated with all or parts of the portfolio. One of the risk measures is expected volatility. Expected volatility measures the expected annual fluctuation in returns, expressed as one standard deviation. The measure takes the correlation between different investments in the portfolio into account. This risk measure provides an estimate of how much the current portfolio value can be expected to fluctuate during the course of a year, based on market conditions over the past three years. In two out of three years, the portfolio’s return is expected to fall within the negative and positive value of the metric. Expected volatility can be expressed in terms of the portfolio’s absolute or relative risk.
All the fund’s investments are included in the calculations of expected relative volatility and are measured against the fund’s benchmark index consisting of global equity and bond indices.
Tables 9.2 and 9.3 present risk both in terms of the portfolio’s absolute risk and the relative risk.
Table 9.2 Portfolio risk, expected volatility, percent
|
Expected volatility, actual portfolio |
||||||||
|---|---|---|---|---|---|---|---|---|
|
30.06.2025 |
Min 2025 |
Max 2025 |
Average 2025 |
31.12.2024 |
Min 2024 |
Max 2024 |
Average 2024 |
|
|
Portfolio |
11.4 |
10.5 |
11.4 |
11.0 |
11.2 |
10.2 |
11.3 |
10.8 |
|
Equities |
13.8 |
12.7 |
13.9 |
13.4 |
13.9 |
12.4 |
14.0 |
13.1 |
|
Bonds |
10.7 |
10.6 |
11.2 |
10.8 |
10.7 |
10.7 |
11.1 |
10.9 |
|
Unlisted real estate |
13.9 |
13.7 |
14.1 |
13.9 |
13.8 |
12.7 |
13.9 |
13.1 |
|
Unlisted infrastructure |
10.4 |
10.4 |
25.7 |
14.6 |
23.9 |
23.9 |
54.0 |
39.6 |
Table 9.3 Relative risk measured against the fund's reference index, expected relative volatility, basis points
|
Expected relative volatility |
||||||||
|---|---|---|---|---|---|---|---|---|
|
30.06.2025 |
Min 2025 |
Max 2025 |
Average 2025 |
31.12.2024 |
Min 2024 |
Max 2024 |
Average 2024 |
|
|
Portfolio |
43 |
42 |
45 |
44 |
44 |
34 |
44 |
37 |
Risk measured as expected volatility indicates an expected annual fluctuation in the value of the fund of 11.4 percent, or approximately NOK 2 200 billion at the end of the first half, compared to 11.2 percent at year-end 2024. Expected volatility for the equity portfolio was 13.8 percent at the end of the first half, down from 13.9 percent at year-end, while expected volatility for the bond portfolio was 10.7 percent, unchanged from year-end.
The fund’s management mandate specifies that expected relative volatility shall not exceed 1.25 percentage points. The fund’s expected relative volatility was 43 basis points at the end of the first half, compared to 44 basis points at year-end 2024.
Expected shortfall is a tail risk measure that quantifies the expected loss of a portfolio in extreme market situations. Expected shortfall measured on relative returns provides an estimate of the annual expected relative underperformance versus the benchmark index. The expected shortfall is calculated at the 97.5 percentile, indicating the average loss when outcomes fall within the worst 2.5 percent of the return distribution. The expected shortfall is defined as the annualised average relative return for the 2.5 percent worst weekly relative returns since January 2007 until the end of the last accounting period, measured in the currency basket.
The Executive Board has determined that the fund shall be managed in such a way that the annual expected shortfall measured against the benchmark index does not exceed 3.75 percentage points. At the end of the first half, expected shortfall was 1.13 percentage points, compared to 1.18 percentage points at year-end 2024.
Credit risk
Credit risk is the risk of losses resulting from issuers of bonds defaulting on their payment obligations. Fixed-income instruments in the portfolio’s benchmark index are all rated investment grade by one of the major credit rating agencies. Investments in bonds are made based on internal assessments with regards to expected return and risk profile.
Table 9.4 Bond portfolio specified by credit rating
|
Amounts in NOK million, |
AAA |
AA |
A |
BBB |
Lower rating |
Total |
|---|---|---|---|---|---|---|
|
Government bonds |
574 680 |
1 948 686 |
376 697 |
128 206 |
47 194 |
3 075 463 |
|
Government-related bonds |
256 091 |
200 956 |
35 875 |
27 096 |
2 140 |
522 157 |
|
Inflation-linked bonds |
66 081 |
231 572 |
14 970 |
19 925 |
1 450 |
333 999 |
|
Corporate bonds |
5 047 |
96 420 |
625 746 |
571 002 |
22 202 |
1 320 416 |
|
Securitised bonds |
287 421 |
30 997 |
1 567 |
- |
- |
319 985 |
|
Total bonds1 |
1 189 321 |
2 508 631 |
1 054 855 |
746 228 |
72 986 |
5 572 020 |
|
Amounts in NOK million, |
AAA |
AA |
A |
BBB |
Lower rating |
Total |
|---|---|---|---|---|---|---|
|
Government bonds |
729 896 |
1 925 725 |
345 833 |
128 129 |
35 051 |
3 164 634 |
|
Government-related bonds |
266 286 |
168 844 |
33 055 |
22 088 |
2 392 |
492 665 |
|
Inflation-linked bonds |
52 249 |
216 988 |
16 470 |
18 084 |
- |
303 792 |
|
Corporate bonds |
10 371 |
93 141 |
614 581 |
565 884 |
18 375 |
1 302 352 |
|
Securitised bonds |
270 150 |
32 744 |
2 102 |
- |
- |
304 996 |
|
Total bonds1 |
1 328 952 |
2 437 443 |
1 012 041 |
734 185 |
55 818 |
5 568 439 |
1 At the end of first half of 2025, bonds received as collateral amounting to NOK 2.5 billion were sold. At year-end 2024, NOK 1.5 billion were sold. These bonds are presented in the balance sheet as a liability under Secured borrowing.
The market value of the bond portfolio increased by NOK 4 billion compared to year-end 2024, to NOK 5 572 billion at the end of the first half. The share of bond holdings categorised with AAA credit rating was reduced to 21.3 percent at the end of the first half, from 23.9 percent at the end of 2024. The reduction in the AAA category was mainly due to reduced holdings of German, Singaporean and Canadian government bonds. Bonds in credit rating categories AA, A and BBB increased somewhat during the period. The share of bond holdings in the Lower rating category increased to 1.3 percent at the end of the first half, from 1.0 percent at year-end. This is mainly due to downgrades of holdings of Colombian government bonds. Overall, the credit quality of the bond portfolio has deteriorated slightly since year-end.
Counterparty risk
Counterparty risk is the risk of loss due to counterparty bankruptcy or other events leading to counterparties defaulting.
Table 9.5 Counterparty risk by type of position
|
Risk exposure |
||
|---|---|---|
|
Amounts in NOK million |
30.06.2025 |
31.12.2024 |
|
Derivatives including foreign exchange contracts |
126 444 |
152 047 |
|
Securities lending |
81 353 |
105 908 |
|
Unsecured bank deposits1 |
35 396 |
23 518 |
|
Repurchase and reverse repurchase agreements |
7 547 |
14 316 |
|
Prime brokerage |
2 551 |
554 |
|
Settlement risk towards brokers and long-settlement transactions |
17,461 |
344 |
|
Total |
270,752 |
296 687 |
1 Includes bank deposits in non-consolidated subsidiaries.
Total counterparty risk exposure was reduced to NOK 270.8 billion at the end of the first half, from NOK 296.7 billion at year-end 2024. The reduction is due to lower risk exposure from derivatives and foreign exchange contracts, securities lending and repurchase and reverse repurchase agreements. Risk exposure from securities lending was reduced by 23.2 percent compared to year-end, while counterparty risk exposure from repurchase and reverse repurchase agreements was reduced by 47.3 percent in the same period. Risk exposure from derivatives including foreign exchange contracts was reduced by 16.8 percent compared to year-end, to 126.4 billion kroner. Derivatives and foreign exchange contracts accounted for 46.7 percent of the total risk exposure at the end of the first half. One-third of this exposure was to a clearing house.
Note 10 Foreign exchange gains and losses
Gains and losses on financial instruments are due to changes in the price of the instrument (security element) and changes in foreign exchange rates (foreign exchange element). These are presented separately in the income statement. See note 11 Foreign exchange gains and losses in the annual report for 2024 for further information.
The fund’s market value in Norwegian kroner is impacted by changes in foreign exchange rates. See table 9.1 in note 9 Investment risk for an overview of the market value of the investment portfolio by asset class, country and currency. The change in the fund’s market value due to changes in foreign exchange rates is presented in table 10.1.
Table 10.1 Specification foreign exchange gain/loss
|
Amounts in NOK million |
1H 2025 |
1H 2024 |
2024 |
|---|---|---|---|
|
Foreign exchange gain/loss – USD/NOK |
-858 235 |
288 729 |
758 950 |
|
Foreign exchange gain/loss – EUR/NOK |
28 481 |
38 770 |
119 705 |
|
Foreign exchange gain/loss – GBP/NOK |
-22 690 |
33 569 |
81 057 |
|
Foreign exchange gain/loss – JPY/NOK |
-29 074 |
-72 745 |
3 936 |
|
Foreign exchange gain/loss – CHF/NOK |
5 300 |
-6 496 |
13 967 |
|
Foreign exchange gain/loss – other |
-134 084 |
32 565 |
94 593 |
|
Foreign exchange gain/loss |
-1 010 301 |
314 393 |
1 072 207 |
Note 11 Management costs
Management costs comprise all costs relating to the management of the fund. These are mainly incurred in Norges Bank, but management costs are also incurred in subsidiaries of Norges Bank that are exclusively established as part of the management of the GPFG’s investments in unlisted real estate and unlisted renewable energy infrastructure.
Management costs in Norges Bank
The Ministry of Finance reimburses Norges Bank for costs incurred in connection with the management of the GPFG, in the form of a management fee. The management fee is equivalent to the actual costs incurred by Norges Bank, including performance-based fees to external managers, and is expensed in the income statement line Management fee. Costs included in the management fee are specified in table 11.1.
Table 11.1 Management fee
|
1H 2025 |
1H 2024 |
2024 |
||||
|---|---|---|---|---|---|---|
|
Amounts in NOK million |
Basis |
Basis |
Basis |
|||
|
Salary, social security and other personnel-related costs |
1 132 |
1 050 |
2 218 |
|||
|
Custody costs |
216 |
243 |
483 |
|||
|
IT services, systems, data and information |
428 |
410 |
815 |
|||
|
Research, consulting and legal fees |
133 |
113 |
255 |
|||
|
Other costs |
148 |
137 |
282 |
|||
|
Allocated costs Norges Bank |
118 |
115 |
241 |
|||
|
Base fees to external managers |
1 059 |
909 |
1 554 |
|||
|
Management fee excluding performance-based fees |
3 234 |
3.1 |
2 977 |
3.3 |
5 848 |
3.3 |
|
Performance-based fees to external managers |
765 |
1 289 |
1 543 |
|||
|
Management fee |
3 999 |
4.2 |
4 267 |
4.4 |
7 390 |
4.1 |
Management costs in subsidiaries
Management costs incurred in wholly owned subsidiaries consist of costs related to the management of the investments in unlisted real estate and unlisted renewable energy infrastructure. These costs are expensed directly in the portfolio result and are not part of the management fee.
Management costs incurred in non-consolidated subsidiaries are presented in the income statement lines Income/expense from unlisted real estate and Income/expense from unlisted infrastructure. Management costs incurred in consolidated subsidiaries are presented in the income statement line Other income/expense. These costs are specified in table 11.2.
Table 11.2 Management costs subsidiaries
|
1H 2025 |
1H 2024 |
2024 |
||||
|---|---|---|---|---|---|---|
|
Amounts in NOK million |
Basis points |
Basis points |
Basis points |
|||
|
Salary, social security and other personnel-related costs |
27 |
15 |
35 |
|||
|
IT services, systems, data and information |
4 |
3 |
6 |
|||
|
Research, consulting and legal fees |
48 |
26 |
59 |
|||
|
Other costs |
32 |
20 |
49 |
|||
|
Total management costs, subsidiaries1 |
110 |
0.1 |
64 |
0.1 |
149 |
0.1 |
|
Of which management costs non-consolidated subsidiaries |
68 |
38 |
88 |
|||
|
Of which management costs consolidated subsidiaries |
43 |
27 |
61 |
|||
1 Costs in the first half of 2025 consisted of NOK 101 million related to investments in unlisted real estate and NOK 9 million related to investments in unlisted infrastructure. For the first half of 2024, NOK 60 million was related to investments in unlisted real estate and NOK 4 million was related to investments in unlisted infrastructure.
Upper limit for reimbursement of management costs
Every year the Ministry of Finance establishes an upper limit for the reimbursement of management costs. Norges Bank is only reimbursed for costs incurred within this limit. Norges Bank is also reimbursed for performance-based fees to external managers. These fees are not measured against the upper limit.
For 2025, total management costs incurred in Norges Bank and its subsidiaries, excluding performance-based fees to external managers, are limited to NOK 8 100 million. In 2024, the limit was NOK 7 100 million.
At the end of the first half, management costs measured against the upper limit amounted to NOK 3 344 million. This consisted of management costs in Norges Bank, excluding performance-based fees to external managers, of NOK 3 234 million and management costs in subsidiaries of NOK 110 million. Total management costs including performance-based fees to external managers amounted to NOK 4 109 million.
Costs measured as a share of assets under management
Annualised costs are also measured in basis points, as a share of average assets under management. Average assets under management are calculated based on the market value of the portfolio in Norwegian kroner at the start of each month in the calendar year.
At the end of the first half, management costs incurred in Norges Bank and its subsidiaries, excluding performance-based fees to external managers, corresponded to 3.2 basis points of assets under management. Management costs including performance-based fees to external managers corresponded to 4.3 basis points of assets under management.
Other operating costs in subsidiaries
In addition to the management costs presented in table 11.2, other operating costs are also incurred in subsidiaries related to the ongoing maintenance, operation and development of the investments. These are not costs related to investing in real estate or renewable energy infrastructure but are costs of operating the underlying investments once they are acquired. Therefore, they are not defined as management costs. Other operating costs are expensed directly in the portfolio result and are not part of the management fee. They are also not included in the costs measured against the upper limit.
Other operating costs incurred in non-consolidated subsidiaries are presented in the income statement lines Income/expense from unlisted real estate and Income/expense from unlisted infrastructure. For further information, see table 6.4 in note 6 Unlisted real estate and table 7.4 in note 7 Unlisted renewable energy infrastructure. Other operating costs incurred in consolidated subsidiaries are presented in the income statement line Other income/expense.
Auditor
Auditor's report
To the Supervisory Council of Norges Bank
Report on Review of Interim Financial Information
Introduction
We have reviewed the accompanying condensed balance sheet of Government Pension Fund Global as of 30 June 2025 and the related condensed income statement, statement of changes in owner’s capital and statement of cash flows for the period 1 January 2025 to 30 June 2025. The Executive Board and management is responsible for the preparation and presentation of this interim financial information in accordance with International Accounting Standard (IAS) 34 Interim Financial reporting as adopted by the EU. Our responsibility is to express a conclusion on this interim financial information based on our review.
Scope of Review
We conducted our review in accordance with International Standard on Review Engagements 2410, Review of Interim Financial Information Performed by the Independent Auditor of the Entity. A review of interim financial information consists of making inquiries, primarily of persons responsible for financial and accounting matters, and applying analytical and other review procedures. A review is substantially less in scope than an audit conducted in accordance with International Standards on Auditing and consequently does not enable us to obtain assurance that we would become aware of all significant matters that might be identified in an audit. Accordingly, we do not express an audit opinion.
Conclusion
Based on our review, nothing has come to our attention that causes us to believe that the accompanying interim financial information is not prepared, in all material respects, in accordance with International Accounting Standard (IAS) 34 Interim Financial reporting as adopted by the EU.
Oslo, 8 August 2025
Ernst & Young AS
Kjetil Rimstad
State Authorized Public Accountant (Norway)
This translation from Norwegian has been prepared for information purposes only.